Day traders are attracted to the foreign exchange market because of its high volatility and by the fact that the Forex market is constantly in operation from Monday to Friday. This means that profits may be made at literally any point in time even while local trading sessions may have ended. Because the forex market is global in scope, trading may take place at any time since there is always at least one session that is open. With that being said, here is a 30-minute MACD Forex trading strategy that you may want to try for yourself.
Indicators and Chart Setup
The indicators that will be used in this trading strategy are the Master MACD indicator, the Exponential Moving Averages, and the CCI indicator. The chart setup for this trade is as follows:
- Two Exponential Moving Averages: faster - 14 (violet) and slower - 21 (blue)
- The Master MACD trend indicator
- Standard CCI (period 14)
This trade may be set up in any session using the currency pair of your choice. However, the preferred time frames are 1-minute, 5-minute, 15-minute, 30-minute or 1-hour time frame.
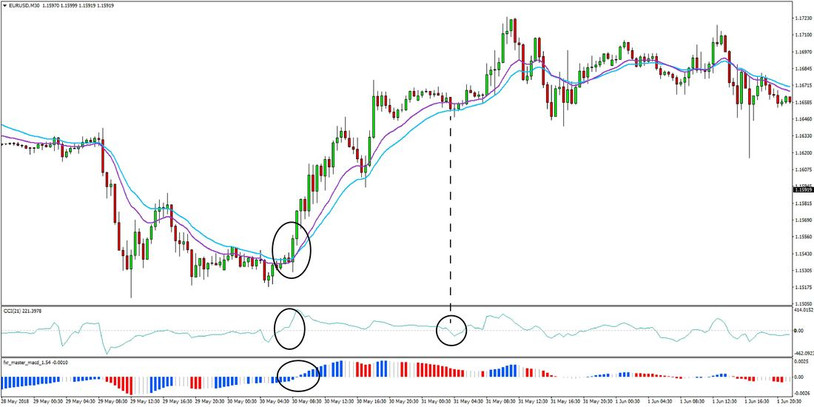
The buy signal is shown with the 3 circles on the left (the 3 conditions for a buy trade), while the vertical line indicates the exit signal (CCI moving below 50)
Buy Trade Entry Rules
You should place a trade if any of the following scenarios occur:
- Look for the 14 EMA (violet) to cross above the 21 EMA (blue). This is an indication that price will be driven upwards.
- Another buy signal is when the histogram of the Master MACD breaks above the 0.00 level.
- A third indicator that you should buy is if the CCI indicator breaks above the 0.00 level.
- You should place your stop loss below the short-term support area.
The image above shows a visual representation of what your chart is likely to look like for a great buy entry.
Signals that you should take profits or exit a buy trade:
- Look if the 14 EMA crosses below the 21 EMA. If this obtains, take profits and exit the trade.
- Another take profit signal is if the Master MACD histogram falls below the 0.00 level.
- Once the blue line of the CCI indicator breaks below the 0.00 level, you should exit the trade.
Sell Trade Entry Rules
Enter with a “sell” position if any of the following conditions obtain:
- If the 14 EMA (violet) crosses below the 21 EMA (blue).
- If the histogram of the Master MACD Indicator breaks below the 0.00 level
- If the blue line of the CCI breaks below the 0.00 level.
- Place your stop loss above the short-term resistance area.
When to Take Profits with a Sell Entry
Take profits under these circumstances:
- If the EMAs cross in the opposite direction of a sell signal (14 EMA goes above 21 EMA).
- If the histogram of the Master MACD goes above the 0.00 level
- If the blue line of the CCI Indicator breaks above the 0.00 level.
Here is an illustration of a sell entry trade:
The sell signal is shown with the 3 circles on the left (the 3 conditions for a sell trade), while the vertical line indicates the exit signal (CCI moving above 50)