
Many people say that long-term trading is way too risky. They may point out that you are putting in too much capital in very few assets or trades (even one, perhaps), while others say that you aren’t making any money in the meantime.
A lot of traders then come out saying that short-term trading is too frantic, that you need to be glued to your screen so you can make a small quantity that could be eaten away by your spreads anyway!
To appease those who’d rather stay in the middle, I’m presenting you here with a few tips for the daily BTC chart!
1. Why Should I Use The Daily (D1) Chart?
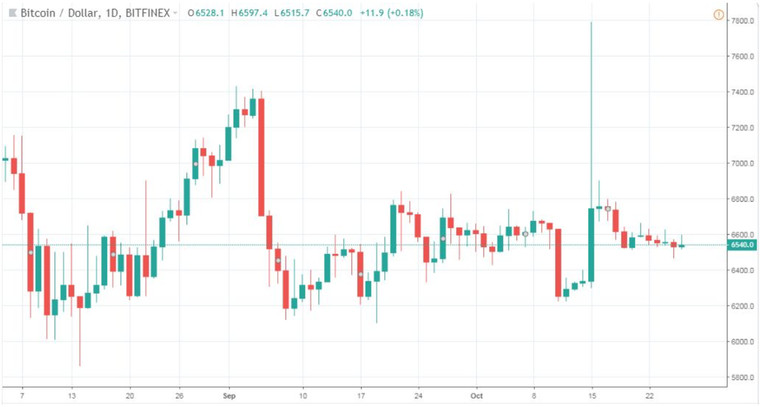
If you look at this graph...
You will quickly spot that there’s much more information and Price Action for holding positions on a weekly basis than in an actual Weekly graph (W1), so daily charts excel for medium-term traders who want to hold week-long positions without having too little or too much information.
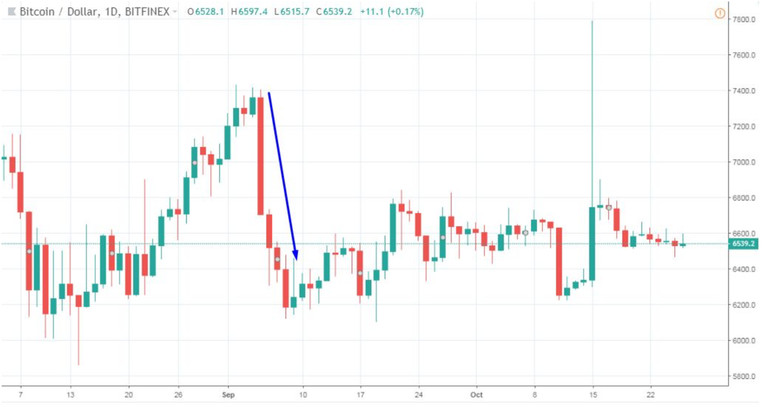
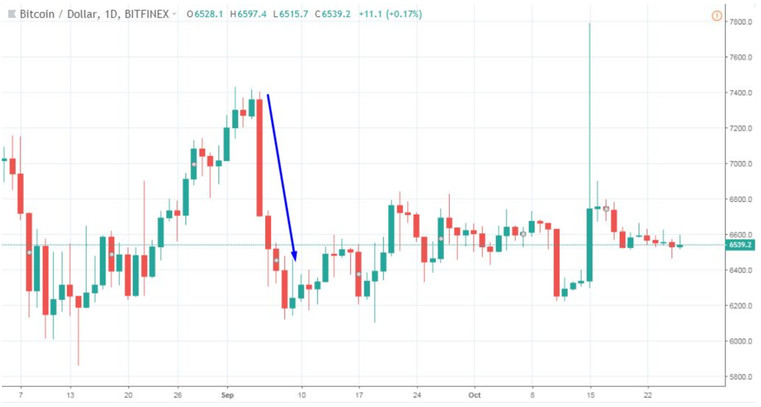
As an example, let’s say you wanted to trade that huge drop from September 5th to the 9th. This is what you’d see on your daily (D1) chart:
This is what you’d see on your Weekly chart (W1):
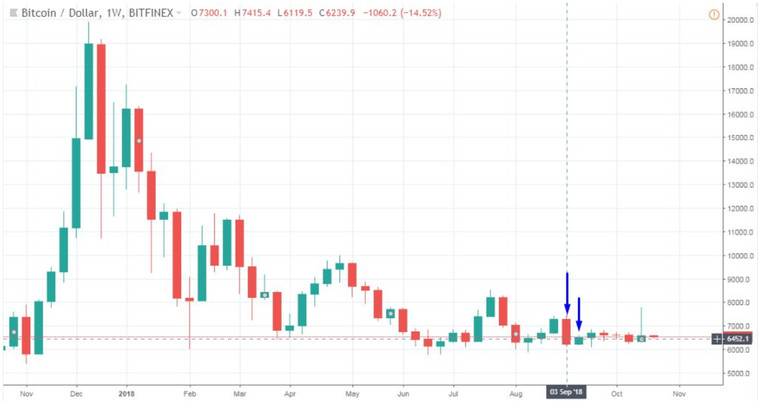
Just two candles. Tough, right? Yet, this is what you’d see on your 4h chart:
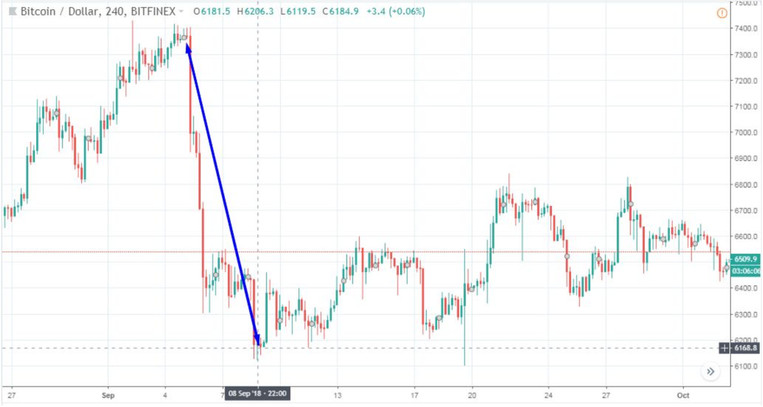
Yikes! That looks a little overkill, doesn’t it? Not only do you have so much information on the screen, but let’s say that you zoom in:
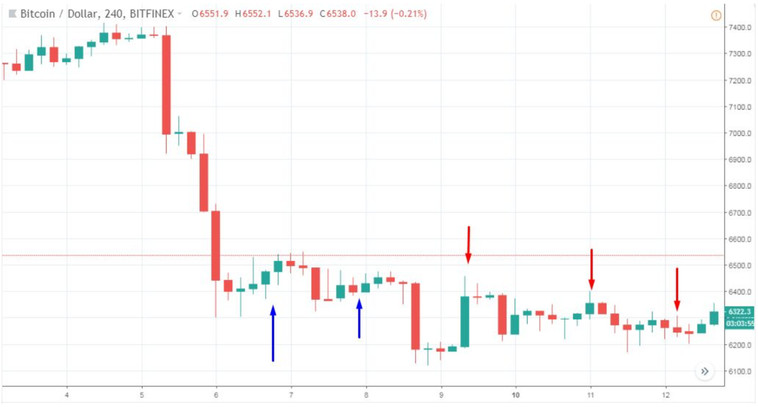
You have less unnecessary price data (considering the medium-term trading), sure, but now you have those brief counter swings (blue arrows) that could make you exit the trade early, and if you survive those, you could then be caught by greed and minimize the issue of the upcoming upswings, making you miss the best price.
If you compare it to this:
It’s easy to see which one’s the best for trading on a weekly basis.
2. Trading The Daily (D1) Chart
When it comes to medium-termed positions, technical indicators start losing their strength in favor of fundamental factors; that’s the real strength of fundamental analysis. However, we’re still sitting in the middle, so using indicators is not really too big of an issue.
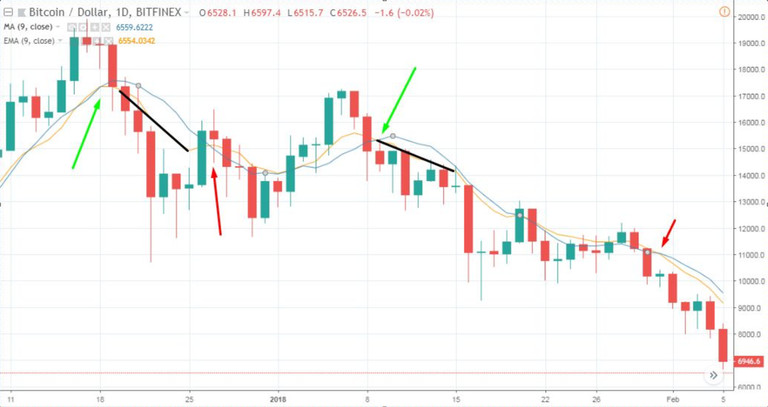
When trading day or week-long positions, moving averages start to become a good indicator so far. It's especially important to use moving averages primarily when there is some direction in the market and to avoid sideways moves. For instance, take a look at this graph:
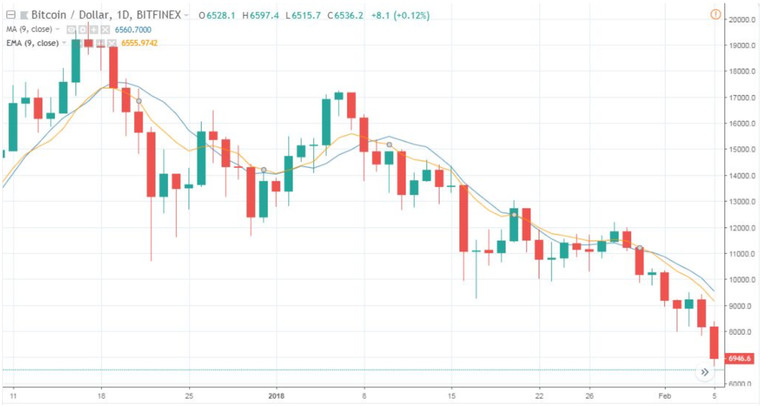
Here, I’m using a 9-day EMA and SMA to measure the legitimacy of a possible trend after a crossover. This couple proved to be good for me, but you need to know how they work to not be fooled by fakeouts.
To illustrate my point, let’s have a look at some important cases:
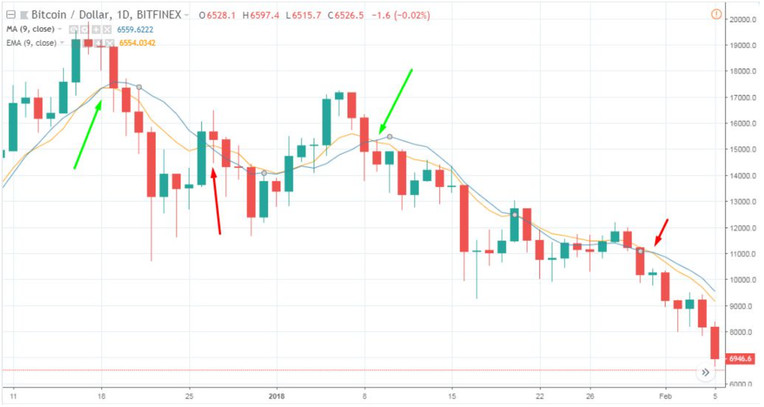
As you can see, in the chart above there were two crossovers that ended up in a breakout and two crosses that didn’t.
Are the indicators failing?
If you’re not knowledgeable on this method of trading, then you may think that there is a 50% chance of the strategy working, but there’s one more indicator to this strategy: Price Action.
In both breakouts, the following two candles stayed below BOTH averages, while this didn’t stay true for the fakeouts. That’s the secret of this trading strategy, patience - and then enter into the confirmed trade.
Using moving averages is a good technique to determine the overall trend in which you should trade and the moving averages can be also treated as support/resistance price levels.
As soon as you determine the direction in which you should enter, simply wait for the confirmation - this can be a breakout, chart pattern or Price Action pattern.
After the trade is opened, place Stop-Loss below the swing high or swing low (or above or below a high or a low of a Price Action pattern). Take-Profit can be set based on the nearest support and resistance price levels, the position can be closed based on swings or we can trail the stop-loss into the profit for example based on the indicator Parabolic SAR.
What to add in the end? KISS, Keep It Simple Stupid!
Take care and trade well!