
Divergence setups are considered by many traders to be the closest you can get to a crystal ball for timing market reversal and continuation.
In this post, we'll be looking at the Hidden Divergence setups.
Hidden divergence setups help a trader validate the continuation of a trend, hence the bottoming of a corrective wave. The setups have been found to offer a profitable reward to risk ratio in the FX and cryptocurrency marke
Description
The Hidden Divergence setups compare the extreme levels (Peaks or Valleys) of price to extreme levels (Peaks or Valleys) of a chosen oscillator. Examples of technical oscillators/indicators are the Relative Strength Index (RSI), MACD, CCI, Stochastic, etc.
Since markets move in either the bullish or bearish direction, the hidden divergence setups are of the bullish and bearish variants, called hidden bullish divergence, and hidden bearish divergence setups.
Hidden bullish or bearish divergence patterns are best suited for trend followers. Do ensure you master the art of identifying and include them in your trading arsenal.
Hidden Bullish Divergence
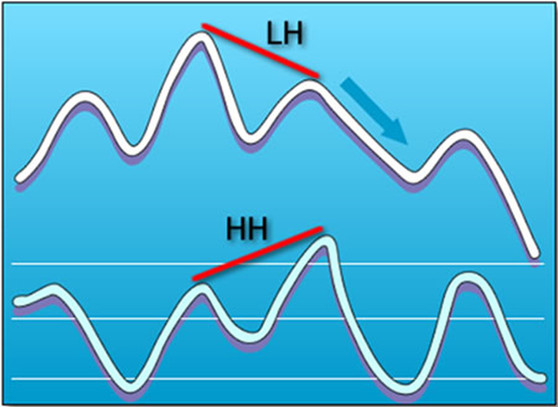
The hidden bullish divergence can be identified in an upward trending market. When the current (second) low of the price makes a higher low (HL) compared to the oscillators' lower low (LL).
Above is a graphical illustration of the hidden bullish divergence.
Let's take the more recent low to be point-B and the previous low to be point-A.
-The price chart starts to form a higher trough at point-B compared to the oscillator forming a lower trough at point-B.
-The price forms a lower trough at point-A compared to the oscillators' higher trough at point-A.
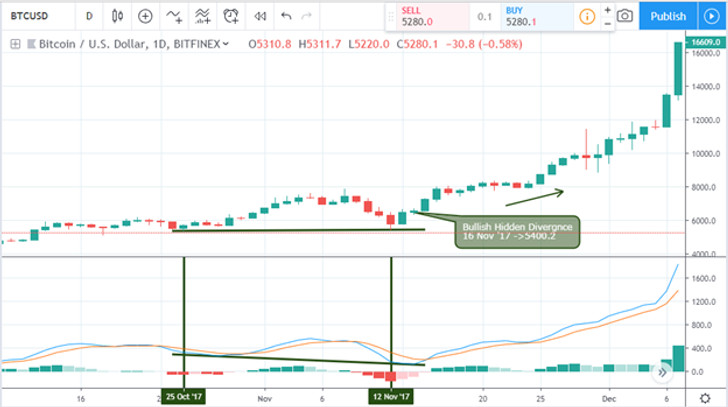
Below is a quick demonstration of the Hidden bullish divergence setup on a live chart, followed by entry and exit rules.
BTCUSD Daily Time Frame Hidden Bullish Divergence
Hidden Bullish Divergence - Entry and Exit Conditions (Stop Loss, Take Profit)
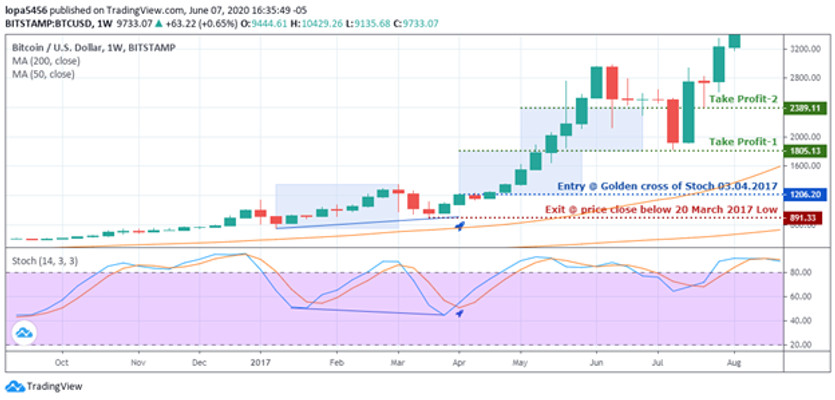
Entry Level:
The above weekly chart illustration shows a hidden bullish divergence signaling a bullish directional bias.
A buy order is signaled at the opening price ($1206.20) of the candlestick after the golden cross of the stochastic oscillator, where the blue line is above the red line.
Exit in Loss
Exits in loss can be done in two different ways.
First is via a Stop Loss, which is a fixed price target.
Second is via a price close below a significant support level in the case of a hidden bullish divergence.
Exit by Stop Loss:
The stop-loss price level from the above weekly chart is placed at a distance (-20%) from the significant support ($891.33).
Exit by Price Close below Significant support
The buy order from a hidden bullish divergence setup is automatically closed if a candlestick from the same time frame that signaled the divergence closes below the significant support (e.g., $891.33 from the above weekly chart).
Exit by Take Profit
Take profit is a fixed price level established by using a rectangle object in color blue, to mark the range A-B as shown in the image above.
We then duplicate the rectangle by holding down control on the keyboard and move its base to the trades' opening price.
The top of the rectangle marks the first take profit at $1805.13, and a second take profit at $2389.11.
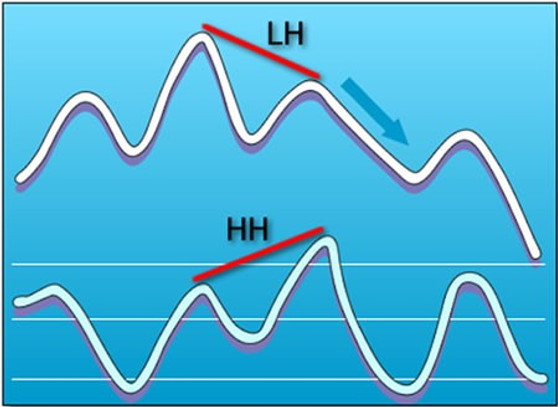
Hidden Bearish Divergence
The hidden bearish divergence confirms that the market may resume an existing bearish trend, or begin a bearish trend altogether.
From the graphical illustration of the hidden bullish divergence above, the more recent high of the price makes a lower high (LH) than the oscillators' higher high (HH).
Let's take the more recent high to be point-B and the previous high to be point-A.
-The price chart starts to form a lower peak at point-B compared to the oscillator forming a higher peak at point-B.
-The price forms a higher peak at point-A compared to the oscillators' lower peak at point-A.
Below is a quick demonstration of the Hidden bullish divergence setup on a live chart, followed by entry and exit rules.
BTCUSD Four Hour Time Frame Hidden Bearish Divergence
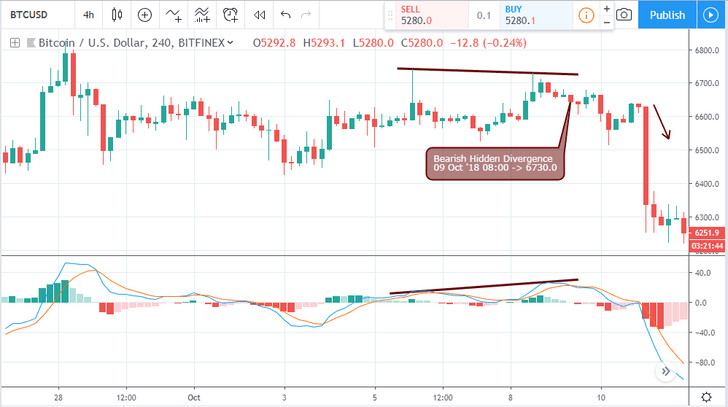
Hidden Bearish Divergence - Entry and Exit Conditions (Stop Loss, Take Profit)
Entry Level:
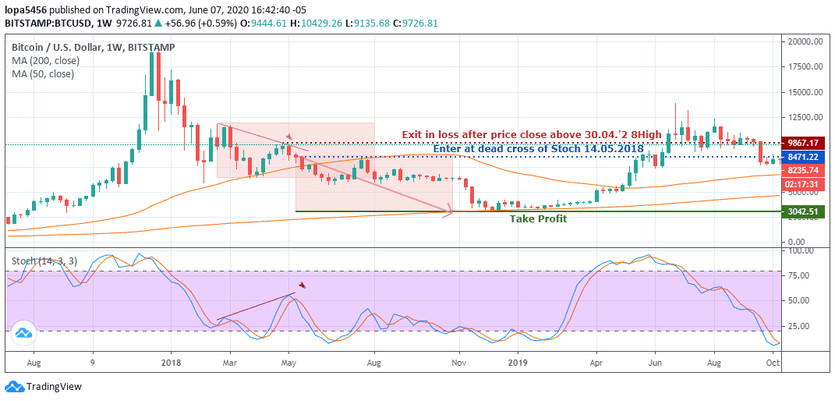
The weekly chart above shows a hidden bearish divergence confirming a bearish directional bias.
A sell order is signaled at the opening price ($8471.22) after the death cross of the stochastic oscillator (blue line is below the red line).
Exit in Loss
Exits in loss can be done in two different ways.
First is via a Stop Loss, which is a fixed price target.
Second is via a price close above a significant resistance level in the case of a hidden bearish divergence.
Exit by Stop Loss:
The stop-loss price level from the above 4hour chart is placed at a distance (3%) from the significant resistance.
Exit by Price Close below Significant support
The sell order from a hidden bearish divergence setup is automatically closed if a candlestick from the same time frame (e.g., weekly) that signaled the divergence closes below the significant resistance (e.g., $9867.17 from the chart above).
Exit by Take Profit
Take profit is a fixed price level established by using a rectangle object to mark the range A-B, as shown in the image above.
We then duplicate the rectangle by holding down control on the keyboard and move its base to the trades' opening price.
The base of the rectangle marks the take profit at $8706.4.
Conclusion and Suggestions
For better results, traders can introduce trend filters like Heiken Ashi, and ADX to reinforce the direction bias, as well as the candlestick patterns.