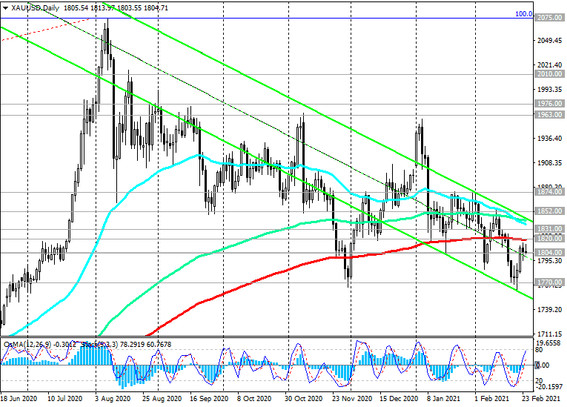
At the beginning of today's European session, the XAU / USD pair is traded near 1804.00 mark and a short-term important support level (ЕМА200 on 1-hour chart).
The pair also remains in the zone below the resistance level 1831.00 (ЕМА200 on the 4-hour chart) and the key resistance level 1820.00 (ЕМА200 on the daily chart), which indicates that XAU / USD is in the bear market territory.
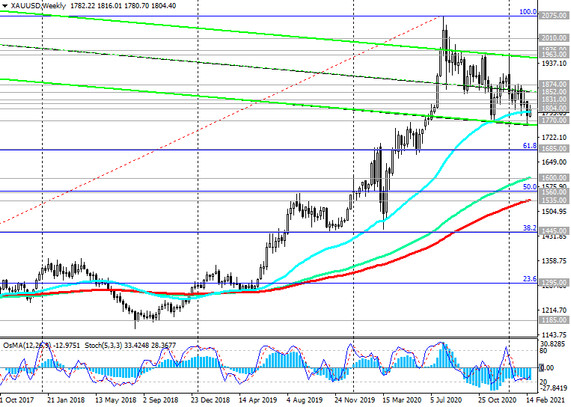
The breakdown of the support level 1804.00 will be a signal for building up short positions, and the breakdown of the local support level 1770.00 (November 2020 lows) will confirm the renewed downward trend towards the support levels 1600.00 (ЕМА144 on the weekly chart), 1560.00 (Fibonacci level 50% of the correction to the growth wave from November 2015 and mark of 1050.00), 1535.00 (ЕМА200 on the weekly chart).
In an alternative scenario, the breakdown of the resistance levels 1852.00 (ЕМА200 on the 4-hour chart), 1874.00 (local resistance level) will confirm the recovery of the positive dynamics of XAU / USD and send it towards local highs (marks 1963.00, 1976.00).
Their breakdown, in turn, will create preconditions for the return of XAU / USD to the zone of record highs reached in early August 2020 near the level 2075.00.
Support levels: 1804.00, 1800.00, 1770.00, 1685.00, 1600.00, 1560.00, 1535.00
Resistance levels: 1820.00, 1831.00, 1852.00, 1874.00, 1963.00, 1976.00, 2010.00, 2075.00
Trading recommendations
Sell Stop 1798.00. Stop-Loss 1823.00. Take-Profit 1770.00, 1685.00, 1600.00, 1560.00, 1535.00
Buy Stop 1823.00. Stop-Loss 1798.00. Take-Profit 1831.00, 1852.00, 1874.00, 1963.00, 1976.00, 2010.00, 2075.00