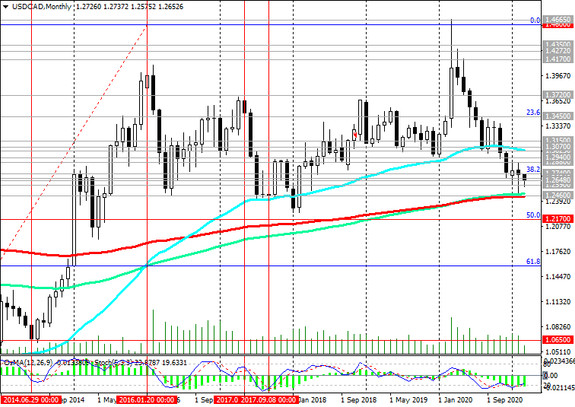
Since early March, USD / CAD has been traded mainly in a range between support level 1.2590 and resistance level 1.2740 (Fibonacci 38.2% level of the downward correction in the wave of USD / CAD growth from 0.9700 to 1.4600).
At the beginning of today's European session and for the 7th trading day in a row, USD / CAD is near the level of 1.2648, through which an important short-term support level (ЕМА200 on the 1-hour chart) passes.
Obviously, the pair needs new drivers to move in one direction or another. Accordingly, the breakdown of the resistance level 1.2740 can provoke a stronger corrective growth towards the resistance levels 1.2880, 1.2940 (ЕМА144 on the daily chart), 1.3025 (ЕМА200 on the daily chart).
A breakdown of the support level 1.2590 will be a signal for the resumption of short positions.
Remaining below the key resistance levels 1.3025, 1.3070, in fact, USD / CAD is in the bear market zone.
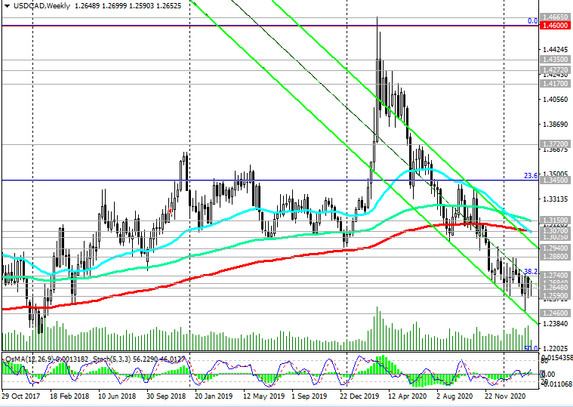
The pair is declining towards the key and long-term support level 1.2460 (ЕМА200 on the monthly chart). Its breakdown will strengthen the tendency to further decline, and a breakdown of the support level 1.2170 (50% Fibonacci level) will finally return USD / CAD to a long-term bearish trend.
Below the resistance level 1.2740, preference should still be given to short positions.
Support levels: 1.2590, 1.2500, 1.2460, 1.2170
Resistance levels: 1.2684, 1.2740, 1.2880, 1.2940, 1.3025, 1.3070, 1.3150, 1.3200
Trading scenarios
Sell Stop 1.2580. Stop-Loss 1.2755. Take-Profit 1.2500, 1.2460, 1.2170
Buy Stop 1.2755. Stop-Loss 1.2580. Take-Profit 1.2880, 1.2940, 1.3025, 1.3070, 1.3160, 1.3200