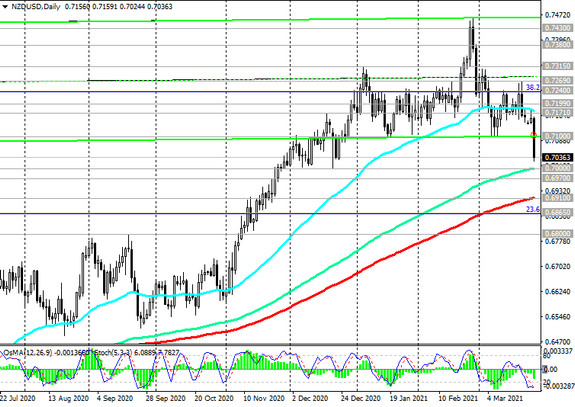
At the time of publication of this article, the NZD / USD pair is traded near 0.7040 mark, still maintaining long-term positive dynamics above the important support levels 0.6970 (ЕМА200 on the monthly chart), 0.6910 (ЕМА200 on the daily chart).

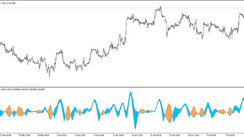
At the same time, one cannot ignore the fact that the NZD weakened sharply today, and the NZD / USD pair broke through the important short-term support levels 0.7171 (ЕМА200 on the 1-hour chart), 0.7199 (ЕМА200 on the 4-hour chart). Further decline may lead the pair to the support levels 0.7000 (ЕМА144 on the daily chart), 0.6970.
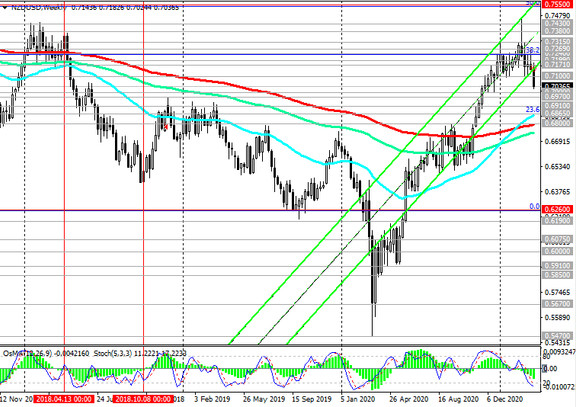
A breakdown of the support levels 0.6910, 0.6865 (Fibonacci level 23.6% of the correction in the global wave of the pair's decline from the level of 0.8820), 0.6800 (ЕМА200 on the weekly chart) will increase the likelihood of a further decline in NZD / USD and its return to the global downtrend that began in July 2014 year.
In an alternative scenario, NZD / USD will resume its growth. The first signal to open long positions will be a breakdown of the short-term resistance level 0.7133 (ЕМА200 on the 15-minute chart). A rise in the zone above 0.7200 mark will confirm the recovery of the bullish trend in NZD / USD.
Support levels: 0.7000, 0.6910, 0.6865, 0.6800
Resistance levels: 0.7100, 0.7133, 0.7171, 0.7199, 0.7240, 0.7269, 0.7315, 0.7380, 0.7430, 0.7550
Trading recommendations
Sell Stop 0.7020. Stop-Loss 0.7115. Take-Profit 0.7000, 0.6900, 0.6865, 0.6800
Buy Stop 0.7115. Stop-Loss 0.7020. Take-Profit 0.7133, 0.7171, 0.7199, 0.7240, 0.7269, 0.7315, 0.7380, 0.7430, 0.7550