
On the weekly chart, AUD / USD is still within the ascending channel. However, a new downward channel has formed on the daily chart.
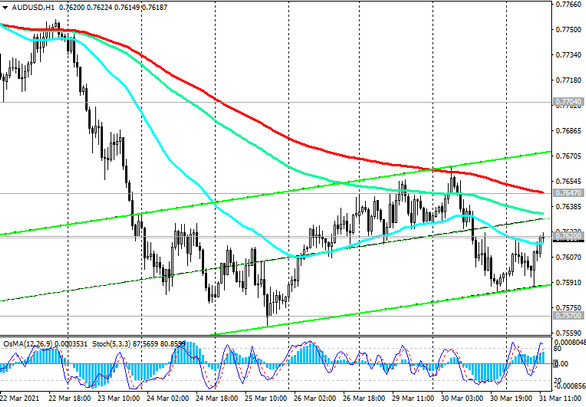
At the same time, on the 1-hour and 4-hour charts, the price broke through the important short-term support levels 0.7647 and 0.7704, which indicates a downward correction.
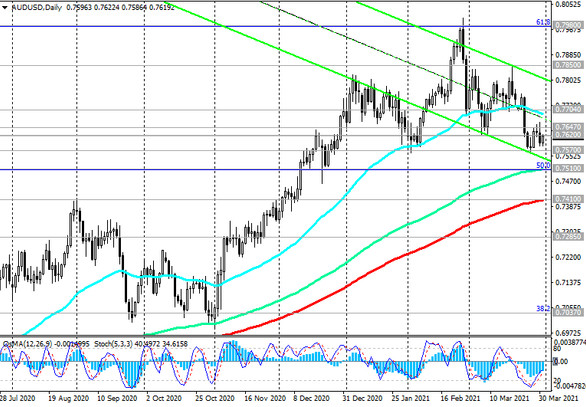
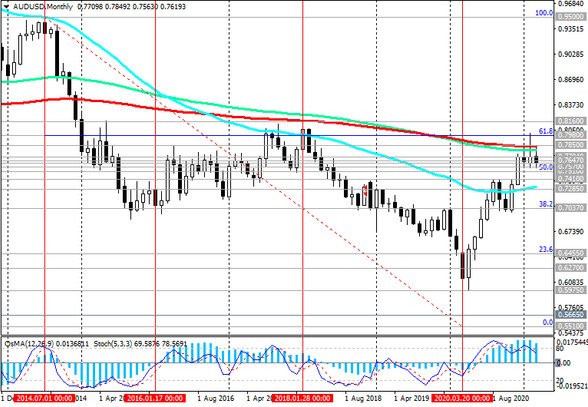
In the zone above the key support levels 0.7410 (ЕМА200 on the daily chart), 0.7285 (ЕМА200 on the weekly chart), the long-term positive dynamics of AUD / USD remains.
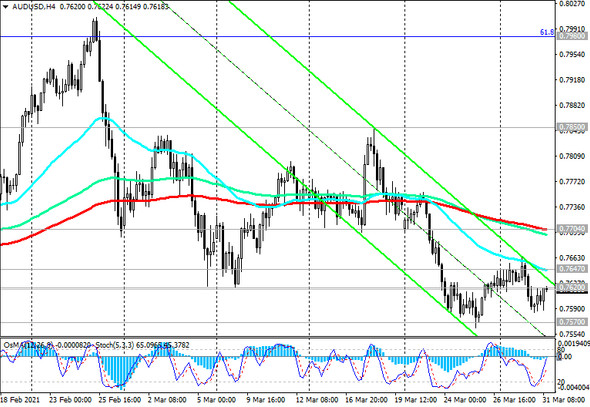
Therefore, the rise into the zone above the level 0.7704 will become a signal indicating the recovery of the upward dynamics. The first signal to resume long positions will be a breakdown of the resistance level 0.7647 (ЕМА200 on the 1-hour chart).
In an alternative scenario, the decline in AUD / USD will continue to support levels 0.7510 (EMA144 on the daily chart and 50% Fibonacci retracement to the wave of the pair's decline from 0.9500 in July 2014 to 2020 lows near 0.5510), 0.7410.
A breakdown of the support level 0.7285 will finally return AUD / USD into a long-term downtrend.
Support levels: 0.7570, 0.7510, 0.7410, 0.7300, 0.7285
Resistance levels: 0.7620, 0.7647, 0.7704, 0.7850, 0.7980, 0.8000, 0.8160
Trading Recommendations
Sell Stop 0.7580. Stop-Loss 0.7670. Take-Profit 0.7510, 0.7410, 0.7300, 0.7285
Buy Stop 0.7670. Stop-Loss 0.7580. Take-Profit 0.7704, 0.7850, 0.7980, 0.8000, 0.8160


