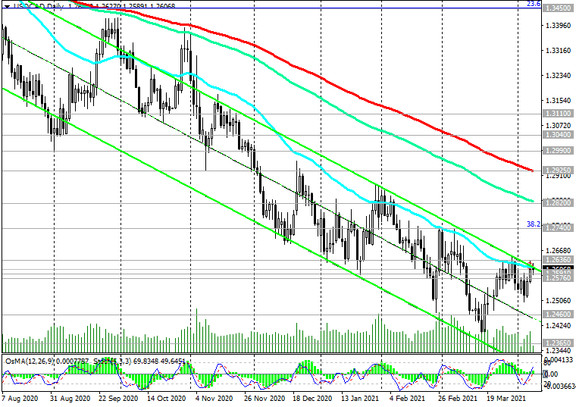
Yesterday USD / CAD broke through the important short-term resistance levels 1.2576 (ЕМА200 on the 1-hour chart), 1.2591 (ЕМА200 on the 4-hour chart), and today it is trying to develop the upward trend, testing the resistance level 1.2615 (ЕМА50 and the upper line of the descending channel at daily chart).
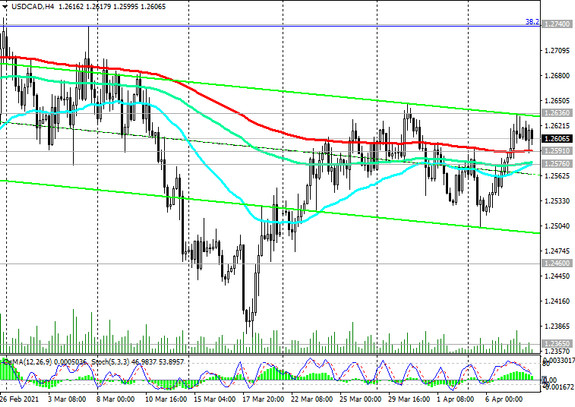
In case of its breakdown and consolidation in the zone above the local resistance level 1.2636, USD / CAD growth may continue towards the resistance level 1.2740 (Fibonacci 38.2% downward correction in the wave of USD / CAD growth from 0.9700 to 1.4600). More distant growth targets are at key resistance levels 1.2820 (ЕМА144 on the daily chart), 1.2925 (ЕМА200 on the daily chart).
Nevertheless, the main scenario so far implies a decline in USD / CAD. The first signal for the pair to resume selling will be a breakdown of the support level 1.2576.
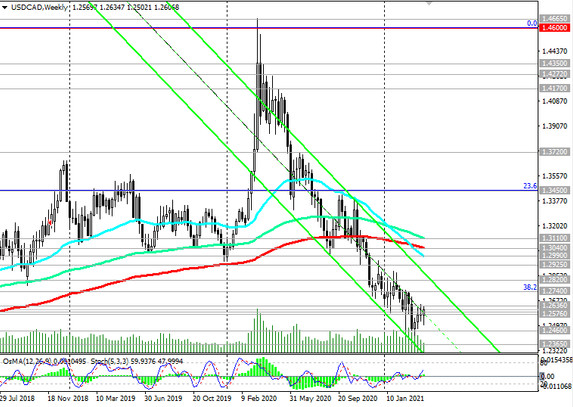
The breakdown of the key long-term support level 1.2460 (ЕМА200 on the monthly chart) will increase the tendency to further decline, and the breakdown of the support level 1.2170 (50% Fibonacci level) will finally return USD / CAD to a long-term bearish trend.
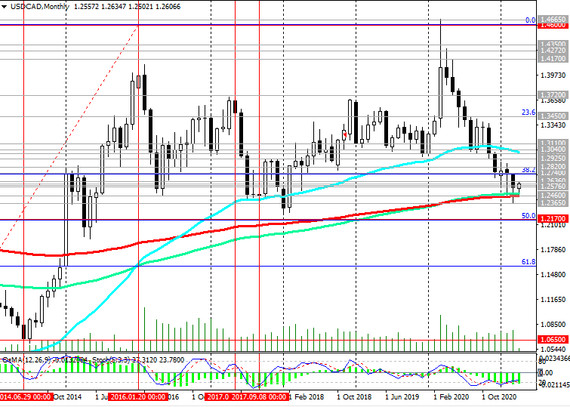
Support levels: 1.2591, 1.2576, 1.2460, 1.2365, 1.2170
Resistance levels: 1.2615, 1.2636, 1.2660, 1.2740, 1.2820, 1.2925, 1.2990, 1.3040, 1.3110
Trading scenarios
Sell Stop 1.2570. Stop-Loss 1.2625. Take-Profit 1.2500, 1.2460, 1.2365, 1.2170
Buy Stop 1.2625. Stop-Loss 1.2570. Take-Profit 1.2636, 1.2660, 1.2740, 1.2820, 1.2925, 1.2990, 1.3040, 1.3110