
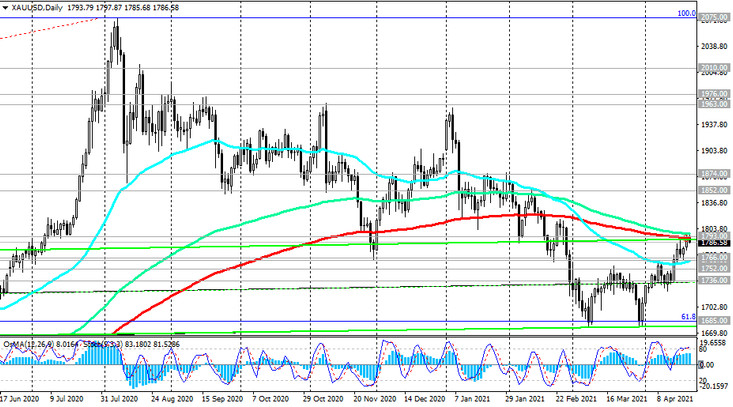
Against the background of the weakening dollar, the XAU / USD pair overcame the resistance levels of 1766.00 and 1763.00 last week and managed to grow into the zone of the key resistance level of 1793.00 (ЕМА200 on the daily chart).
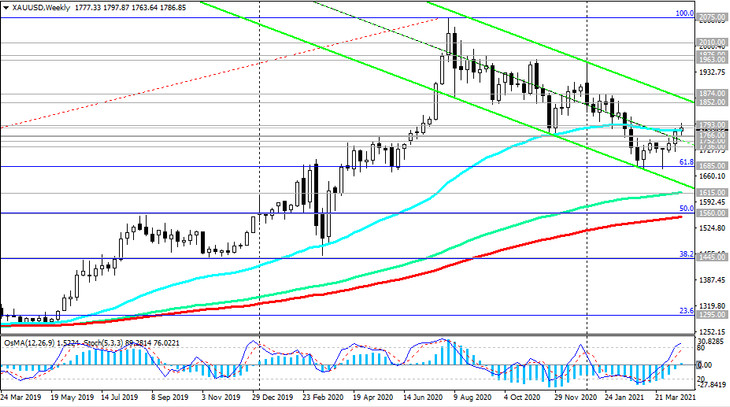
Below this resistance level, the XAU / USD pair remains in the bear market zone and within the descending channel on the weekly chart.
Its lower border at the moment is near the key support levels of 1615.00 (EMA144 on the weekly chart), 1560.00 (EMA200 on the weekly chart and 50% Fibonacci level of the correction to the growth wave since November 2015 and 1050.00 mark).
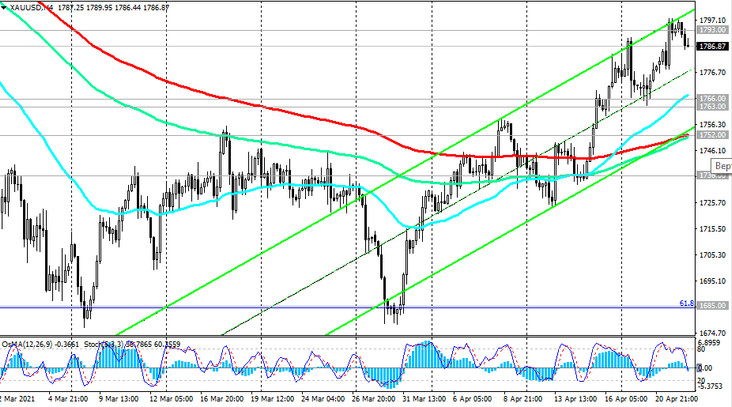
If XAU / USD resumes its downward trend, the first signal for selling the pair will be a breakdown of the short-term support level of 1785.00 (ЕМА200 on a 15-minute chart). Breakdown of important short-term support levels at 1766.00 (ЕМА200 on the 1-hour chart), 1763.00 (ЕМА50 on the daily chart) will confirm the downside scenario.
In an alternative scenario, a breakdown of the local resistance level of 1797.00 will increase the likelihood of further growth of XAU / USD towards the upper border of the descending channel on the daily chart and the level of 1852.00.
Support levels: 1785.00, 1766.00, 1763.00, 1752.00, 1736.00, 1700.00, 1685.00, 1615.00, 1560.00
Resistance levels: 1793.00, 1797.00, 1852.00, 1874.00, 1963.00, 1976.00, 2010.00, 2075.00
Trading recommendations
Sell Stop 1779.00. Stop-Loss 1791.00. Take-Profit 1766.00, 1763.00, 1752.00, 1736.00, 1700.00, 1685.00, 1615.00, 1560.00
Buy Stop 1791.00. Stop-Loss 1779.00. Take-Profit 1793.00, 1797.00, 1852.00, 1874.00, 1963.00, 1976.00, 2010.00, 2075.00


