As we noted above, the S&P 500 remains positive, but is traded in a range after yesterday's fall.
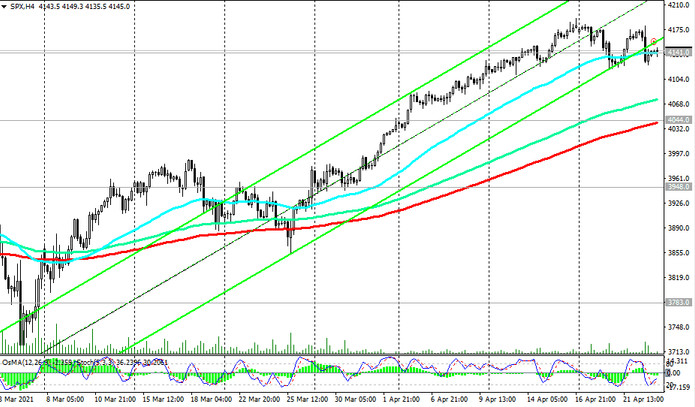
Above the support levels 4141.0 (ЕМА200 on the 1-hour chart), 4044.0 (ЕМА200 on the 4-hour chart), 4000.0 (ЕМА50 on the daily chart), nothing threatens long positions.
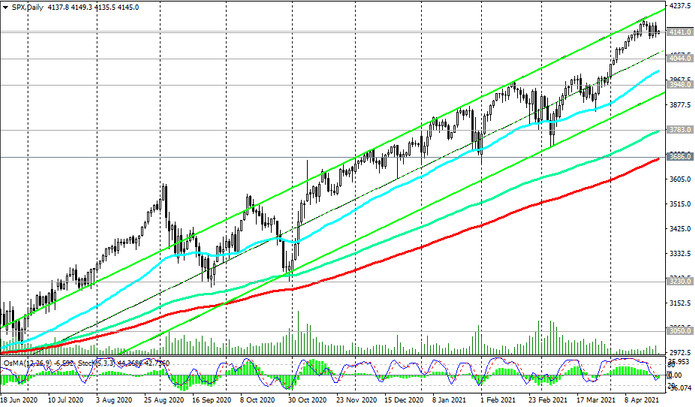
A breakdown of the local resistance level 4170.0 will confirm the forecast for further growth in the S&P 500.
In an alternative scenario, a breakdown of the support level 3948.0 (the lower line of the ascending channel on the daily chart) will create risks for the S&P 500 to decline to the key support levels 3783.0 (ЕМА144 on the daily chart), 3686.0 (ЕМА200 on the daily chart). The first signal for the implementation of this scenario will be a breakdown of the support levels 4141.0, 4118.0.
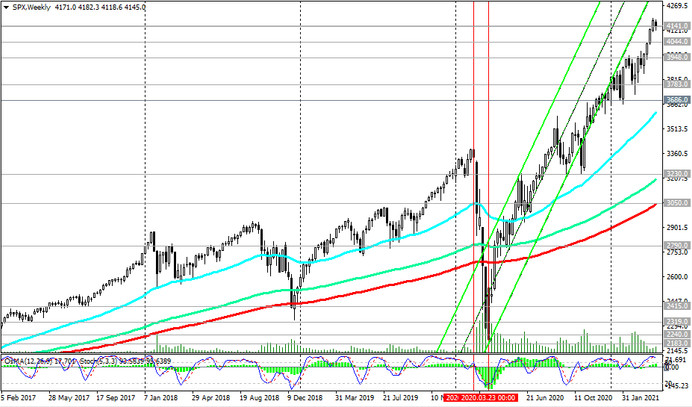
However, such a scenario is still unlikely. In general, the long-term bullish trend of the S&P 500 and the American stock market in general remains.
Support levels: 4141.0, 4118.0, 4044.0, 4000.0, 3948.0, 3783.0, 3686.0, 3600.0
Resistance levels: 4170.0, 4200.0
Trading recommendations
Sell Stop 4116.0. Stop-Loss 4170.0. Targets 4100.0, 4044.0, 4000.0, 3948.0, 3783.0, 3686.0, 3600.0
Buy Stop 4170.0. Stop-Loss 4116.0. Targets 4200.0, 4300.0