Staying in the zone above long-term key support levels 3880.0 (ЕМА144 on the daily chart), 3750.0 (ЕМА200 on the daily chart), the S&P 500 remains in the bull market zone.
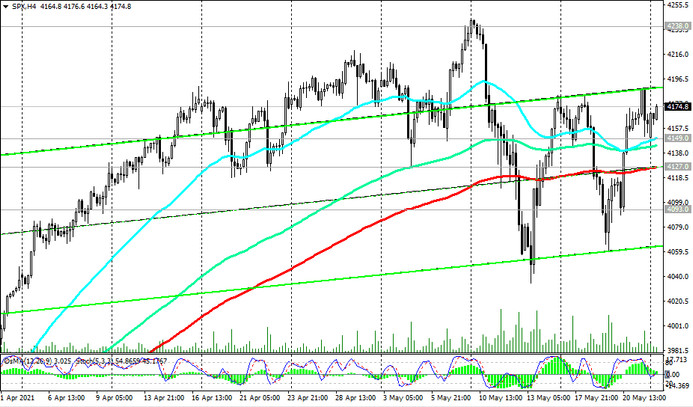
Above the important short-term support levels 4149.0 (ЕМА200 on the 1-hour chart), 4127.0 (ЕМА200 on the 4-hour chart), 4093.0 (ЕМА50 on the daily chart), nothing threatens long positions in the S&P 500.
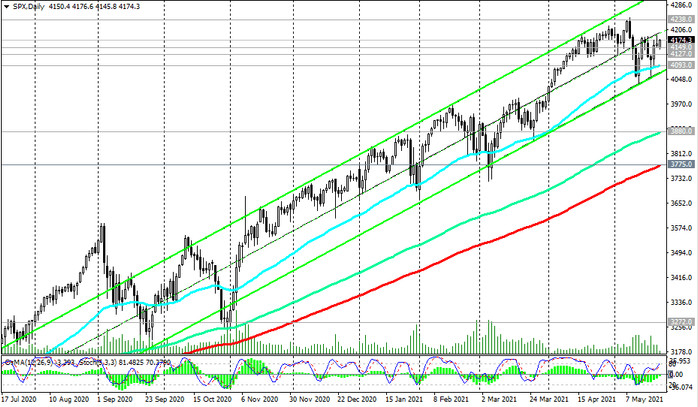
S&P 500 futures continue to rise in upward channels on the daily and weekly charts.
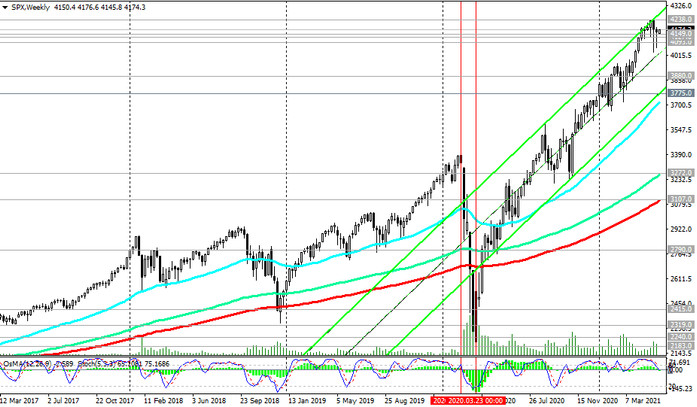
A breakdown of the local resistance level 4238.0 will confirm the correctness of the strategy to strengthen long positions and send the S&P 500 towards the upper boundary of the ascending channel on the daily chart and 4300.0 mark, the nearest upside target.
In general, despite the decline in the previous two weeks, the long-term bullish trend of the S&P 500 and the American stock market in general persists.
In an alternative scenario, the breakdown of the support levels 4093.0, 4034.0 (the local minimum of this month) will be a reason for thinking about the possibility of a deeper corrective decline to the support levels 3880.0, 3775.0. The first signal for this may be a breakdown of the support level 4149.0.
Support levels: 4149.0, 4127.0, 4093.0, 4034.0, 4000.0, 3880.0, 3775.0, 3700.0
Resistance levels: 4238.0, 4300.0, 4400.0
Trading recommendations
Sell Stop 4144.0. Stop-Loss 4192.0. Targets 4127.0, 4093.0, 4034.0, 4000.0, 3880.0, 3775.0, 3700.0
Buy Stop 4192.0. Stop-Loss 4144.0. Targets 4238.0, 4300.0, 4400.0