
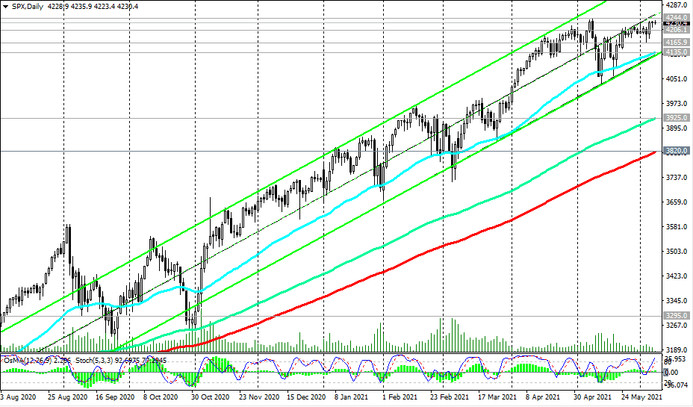
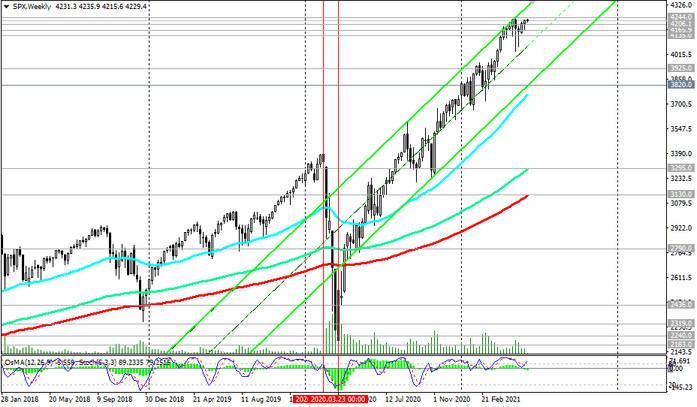
The S&P 500 remains in the long-term bull market zone.
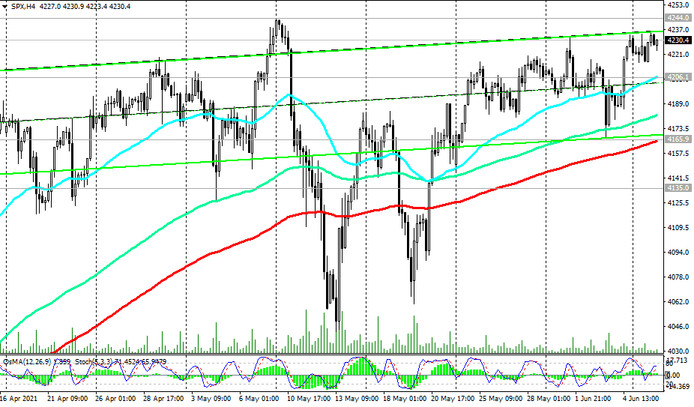
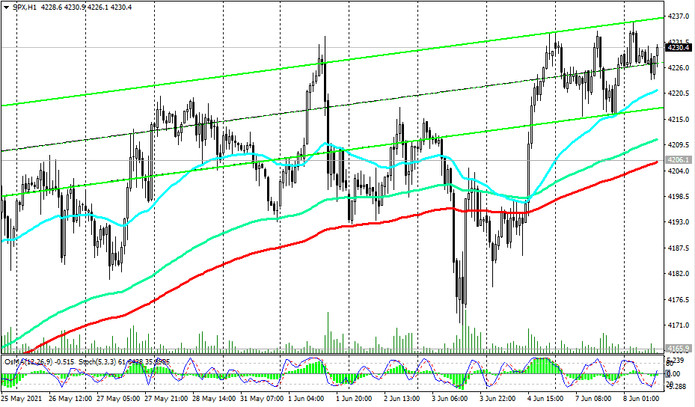
Above the important short-term support levels 4206.0 (ЕМА200 on the 1-hour chart), 4166.0 (ЕМА200 on the 4-hour chart), 4135.0 (ЕМА50 and the lower line of the ascending channel on the daily chart), nothing threatens long positions in the S&P 500.
A breakdown of the local resistance level of 4244.0 (last month's highs and absolute highs) will be a signal for the resumption of the bullish trend of the S&P 500 and its growth towards the upper border of the ascending channel on the weekly chart and the 4325.0 mark.
In an alternative scenario, the breakdown of support levels 4166.0, 4135.0 will be a signal for a possibly deeper corrective decline to support levels 3925.0 (ЕМА144 on the daily chart), 3820.0 (ЕМА200 on the daily chart). The first signal for this may be a breakdown of the support level 4206.0.
Support levels: 4206.0, 4166.0, 4135.0, 4000.0, 3925.0, 3820.0
Resistance levels: 4244.0, 4300.0, 4325.0, 4400.0
Trading recommendations
Sell Stop 4203.0. Stop-Loss 4238.0. Targets 4166.0, 4135.0, 4000.0, 3925.0, 3820.0 Buy Stop 4238.0. Stop-Loss 4203.0. Targets 4244.0, 4300.0, 4325.0, 4400.0


