Since the end of May, the NZD / USD pair has been declining, and, having broken through the important long-term support level 0.7020 (ЕМА200 on the daily chart), it is trying to develop the downward dynamics, moving in the descending channel on the weekly chart towards support levels 0.6865 (Fibonacci level 23.6% of the correction in the global wave of the pair's decline from the level of 0.8820), 0.6840 (ЕМА200 on the weekly chart).
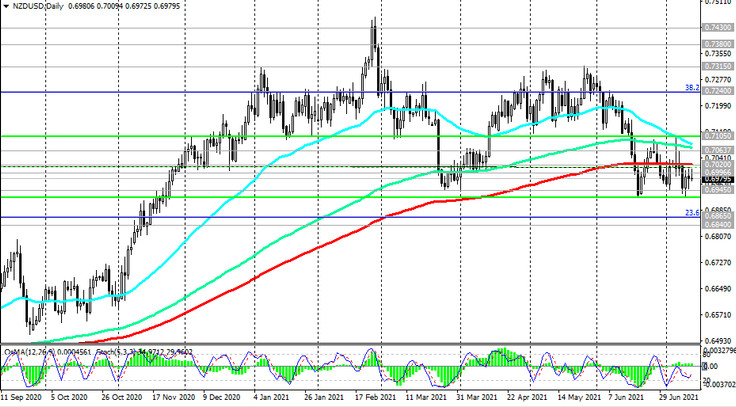
The breakout of the 0.6865, 0.6840 support levels could finally push the NZD / USD into the bear market zone and return it into the global downtrend that began in July 2014.
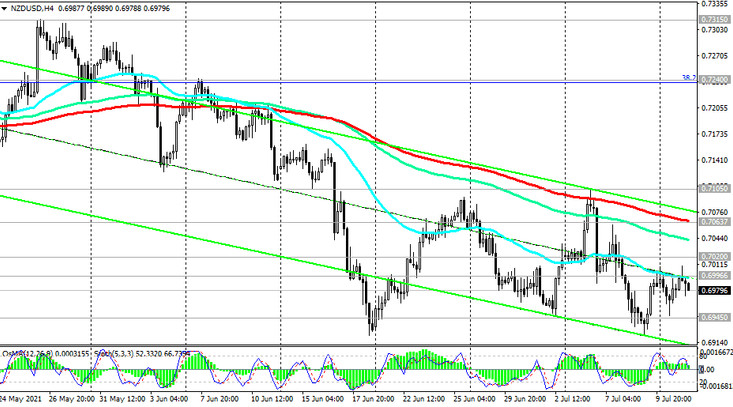
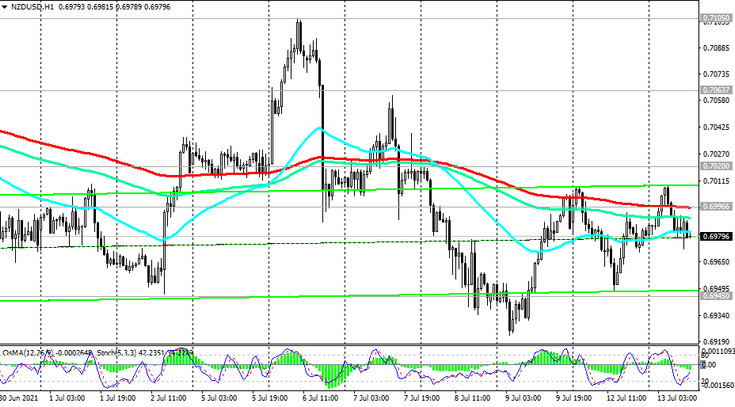
In the alternative scenario, and after the breakdown of the resistance level 0.7020, NZD / USD will resume growth, and the breakdown of the resistance levels 0.7063 (ЕМА200 on the 4-hour chart), 0.7105 (local resistance level) will confirm the resumption of the bullish trend.

After the breakdown of the local resistance level 0.7105, the growth target will be the resistance levels 0.7240 (Fibonacci level 38.2%), 0.7300. More distant growth targets are located at resistance levels 0.7430, 0.7550 (50% Fibonacci level), 0.7600.
Support levels: 0.6945, 0.6900, 0.6865, 0.6840
Resistance levels: 0.7020, 0.7063, 0.7105, 0.7240, 0.7315, 0.7380, 0.7430, 0.7550, 0.7600
Trading recommendations
Sell Stop 0.6970. Stop-Loss 0.7025. Take-Profit 0.6945, 0.6900, 0.6865, 0.6840, 0.6800
Buy Stop 0.7025. Stop-Loss 0.6970. Take-Profit 0.7063, 0.7105, 0.7240, 0.7315, 0.7380, 0.7430, 0.7550, 0.7600