

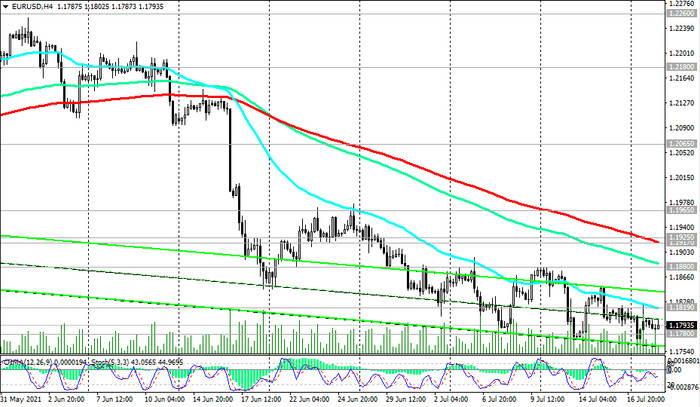
After the price broke the key long-term support level 1.1925 (ЕМА200 on the daily EUR / USD chart) last month, the EUR / USD continued to decline. At the moment, the pair is traded near the support level 1.1780 (Fibonacci level 38.2% of the upward correction in the wave of the pair's decline from the level 1.3870, which began in May 2014, and the highs of 2018).
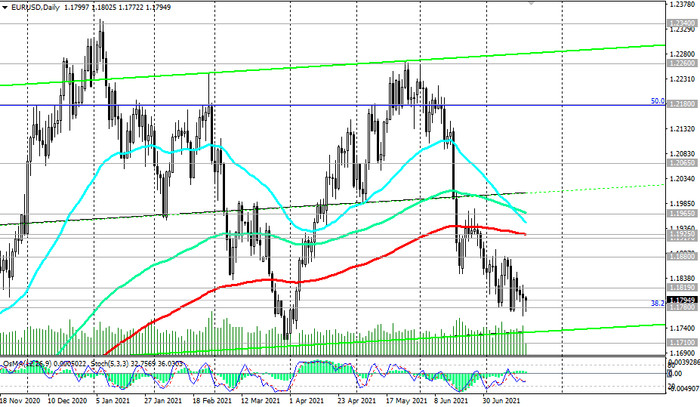
The pair remains under the pressure of the strengthening dollar, and the breakdown of the local support level 1.1710 may trigger its deeper decline. A breakdown of the long-term key support level 1.1620 (ЕМА200 on the weekly chart) may finally break the EUR / USD bullish trend.
In the alternative scenario, and after consolidation in the zone above the resistance levels 1.1880 (ЕМА50 on the weekly chart) and 1.1925, one should expect renewed growth in EUR / USD.
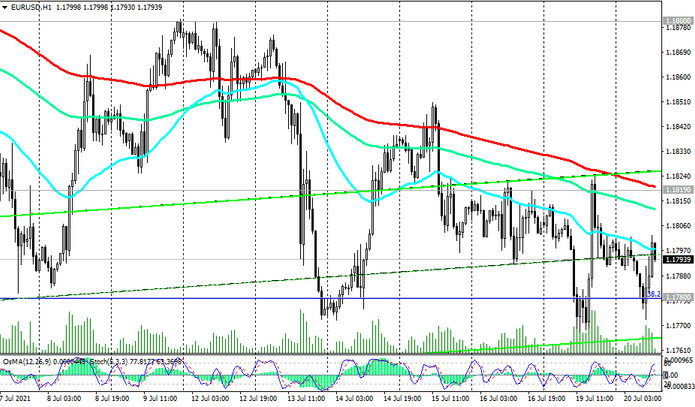
The first signal for the implementation of this scenario may be a breakdown of the important short-term resistance level 1.1819 (ЕМА200 on the 1-hour chart), and distant growth targets are located at resistance levels 1.2260, 1.2340, 1.2450, 1.2500, 1.2580 (Fibonacci level 61.8%), 1.2600.
Support levels: 1.1780, 1.1710, 1.1620
Resistance levels: 1.1819, 1.1880, 1.1917, 1.1925, 1.1965, 1.2065, 1.2180, 1.2260, 1.2340, 1.2450, 1.2580, 1.2600
Trading Recommendations
Sell Stop 1.1760. Stop-Loss 1.1830. Take-Profit 1.1710, 1.1620
Buy Stop 1.1830. Stop-Loss 1.1760. Take-Profit 1.1880, 1.1917, 1.1925, 1.1965, 1.2065, 1.2180, 1.2260, 1.2340, 1.2450, 1.2580, 1.2600


