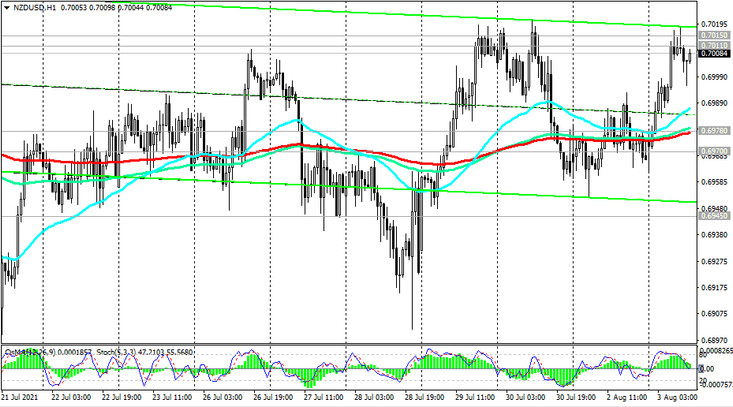
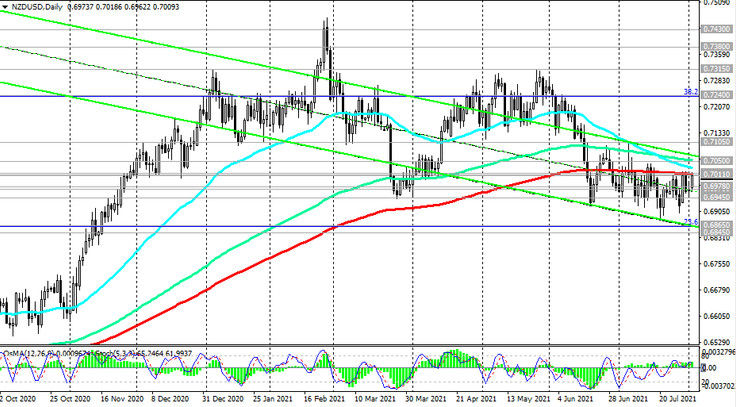
As we noted above, today NZD / USD, having received support from the RBNZ, which announced its intention to tighten mortgage lending standards from October 1, rose quite sharply, making another attempt to break through the key resistance level 0.7015 (ЕМА200 on the daily chart).
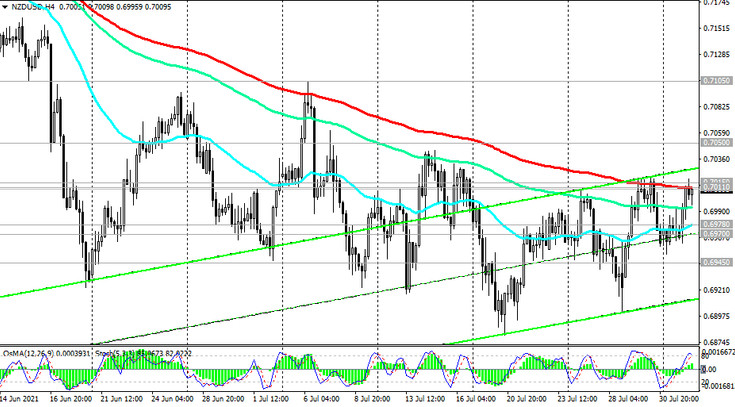
At the time of publication of this article, the price broke through important short-term resistance levels 0.6978 (ЕМА200 on the 1-hour chart), 0.7011 (ЕМА200 on the 4-hour NZD / USD chart), and the technical indicators OsMA and Stochastic on the 1-hour, 4-hour, daily, weekly NZD / USD charts signaling long positions.
In case of consolidation in the indicated zone, the growth of NZD / USD may continue to the resistance level 0.7050. A breakdown of the local resistance level 0.7105 (July highs) will become a confirmation signal for the resumption of the long-term upward dynamics of NZD / USD.
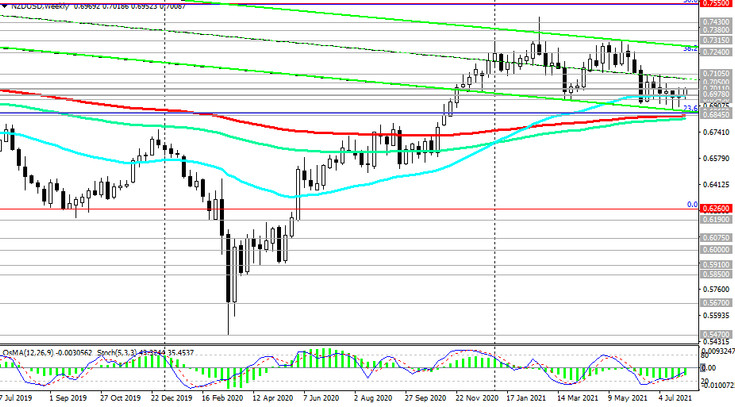
After the breakdown of the local resistance level 0.7105, the growth target will be the resistance levels 0.7240 (Fibonacci level 38.2%), 0.7300. More distant growth targets are located at resistance levels 0.7430, 0.7550 (50% Fibonacci level), 0.7600.
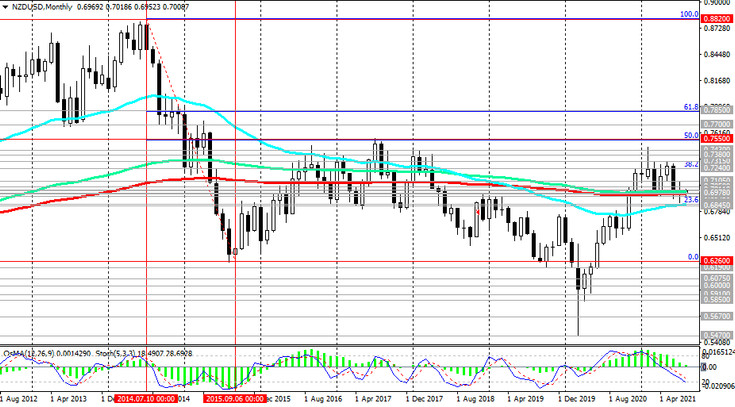
In the alternative scenario, and after the breakdown of the support level 0.6978, NZD / USD will resume decline towards the lower border of the descending channels on the daily and weekly charts, which passing near the 0.6865, 0.6845 marks. Key long-term support levels are also located at these marks: Fibonacci level 23.6% (correction in the global wave of the pair's decline from 0.8820) and ЕМА200 on the weekly chart. Their breakout could finally push the NZD / USD into a bear market zone and return it into the global downtrend that began in July 2014.
Support levels: 0.6978, 0.6970, 0.6945, 0.6900, 0.6865, 0.6845
Resistance levels: 0.7011, 0.7015, 0.7050, 0.7105, 0.7240, 0.7315, 0.7380, 0.7430, 0.7550, 0.7600
Trading recommendations
Sell Stop 0.6990. Stop-Loss 0.7020. Take-Profit 0.6978, 0.6970, 0.6945, 0.6900, 0.6865, 0.6845
Buy Stop 0.7020. Stop-Loss 0.6990. Take-Profit 0.7050, 0.7105, 0.7240, 0.7315, 0.7380, 0.7430, 0.7550, 0.7600