
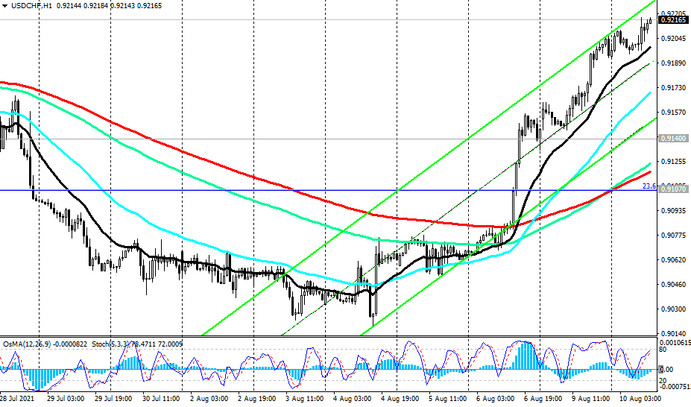
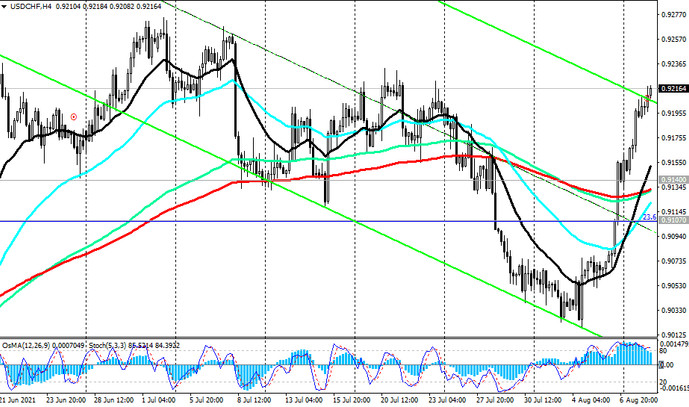
At the beginning of today's European session, USD / CHF is traded near the mark of 0.9216, maintaining a tendency for further growth, at least the technical indicators OsMA and Stochastic are signaling this.
Against the backdrop of strong data from the US labor market and the strengthening of the dollar, the pair managed to break into the zone above the important long-term resistance level 0.9140 (ЕМА200 on the daily chart).
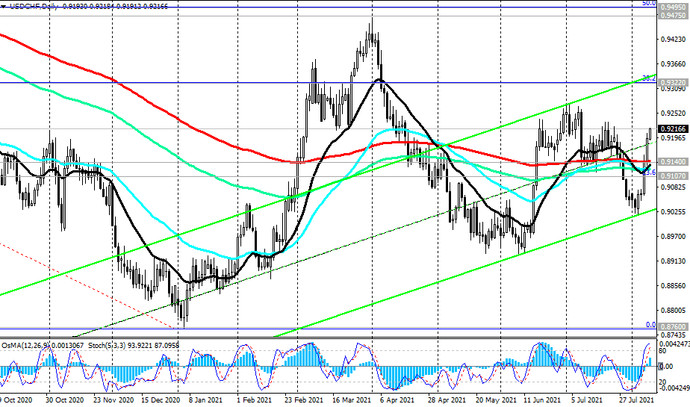
A breakdown on the eve of the resistance level 0.9107 (Fibonacci level 23.6% of the retracement to the decline wave that began in April 2019 near the 1.0235 mark) is also the first signal for the completion of the USD / CHF downward correction. The breakdown of the support level 0.9322 (Fibonacci level 38.2%) will be the second confirming signal of the completion of the USD / CHF correction, which began in April 2019 near the 1.0235 mark, according to the principles of the Fibonacci levels strategy trading. Slightly above 0.9322 is the upper border of the ascending channel oh the daily chart, the breakdown of which will be another confirmation signal for the build-up of long positions in USD / CHF.
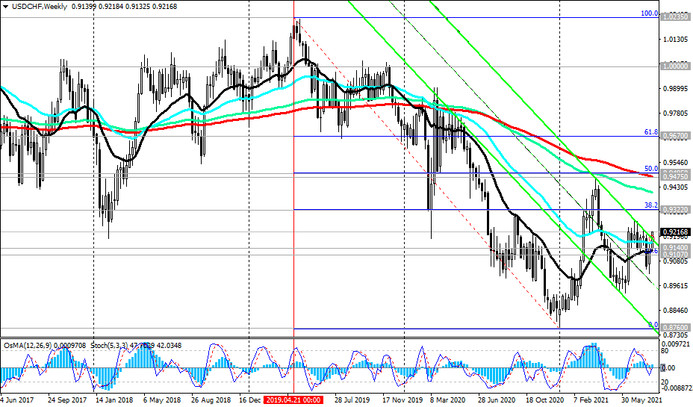
The breakdown of the resistance levels 0.9475 (Fibonacci level 50%), 0.9495 (ЕМА200 on the weekly chart) will increase the chances of USD / CHF returning to the long-term bull market, and with the breakdown of the resistance level 1.0360 (ЕМА200 on the monthly chart), the pair's downward correction will be completed.
In an alternative scenario, a signal for selling will be a breakdown of the support levels 0.9140, 0.9107. In this case, USD / CHF may again go deep into the descending channel on the weekly chart. Its lower border, which will be the target of the decline, passes through the 0.8760 mark.
Support levels: 0.9140, 0.9107, 0.9000, 0.8760
Resistance levels: 0.9322, 0.9475, 0.9495, 0.9555, 0.9670
Trading scenarios
Sell Stop 0.9185. Stop-Loss 0.9225. Take-Profit 0.9140, 0.9107, 0.9000, 0.8760
Buy Stop 0.9225. Stop-Loss 0.9185. Take-Profit 0.9322, 0.9475, 0.9495, 0.9555, 0.9670


