
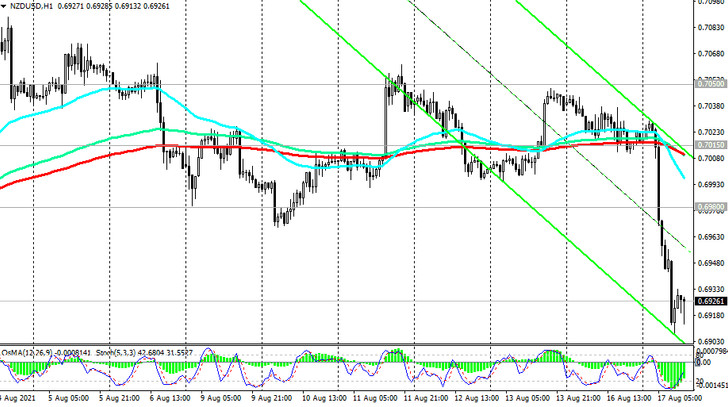
Having received support at the beginning of the month from the RBNZ, which announced its intention to tighten mortgage lending standards, the NZD / USD rose quite sharply, making another attempt to break through the key resistance level 0.7015 (ЕМА200 on the daily chart).
This breakdown took place, however, the growth was still limited by another strong resistance level 0.7050 (ЕМА144 on the daily chart), and by the beginning of today NZD / USD had stabilized at 0.7015 level on the eve of the RBNZ meeting on Wednesday.
However, today the NZD / USD has dropped sharply, and the NZD has become the leader of today's fall, after reports of the first case of infection with coronavirus in New Zealand since February.
NZD / USD declined by more than 1.5%, and at the time of this article's publication, the pair is near the 0.6925 mark, which corresponds to the June lows.
But the story with sharp fluctuations in quotations, it seems, did not end there. Tomorrow at 02:00 (GMT) the RBNZ decision on rates will be published.
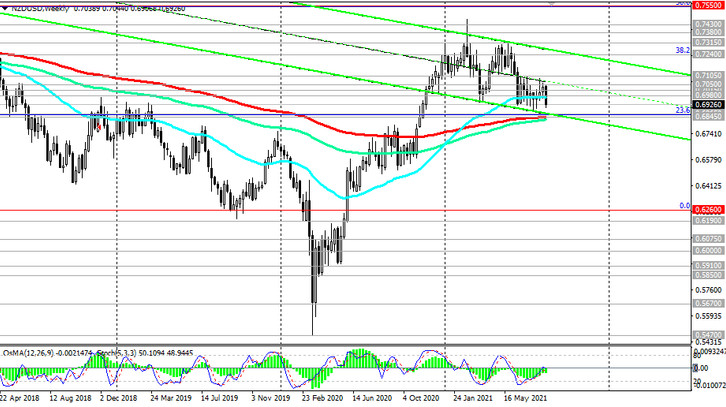
In case of further decline, NZD / USD will go to support levels 0.6865 (Fibonacci 23.6% retracement in the global wave of the pair's decline from 0.8820) and 0.6845 (ЕМА200 on the weekly chart). Their breakout could finally push the NZD / USD into a bear market zone and return it to the global downtrend that began in July 2014.
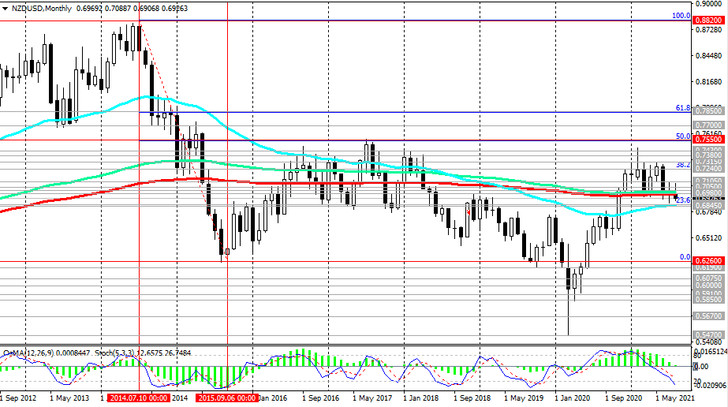
In an alternative scenario and after the breakdown of the resistance levels 0.7015, 0.7050, the growth of NZD / USD may continue towards the local resistance level 0.7105 (July highs). Its breakdown will become a confirming signal of the resumption of the long-term upward dynamics of NZD / USD, and the growth target will be the resistance levels 0.7240 (Fibonacci 38.2% level), 0.7300. More distant growth targets are located at resistance levels 0.7430, 0.7550 (50% Fibonacci level), 0.7600.
Support levels: 0.6900, 0.6865, 0.6845
Resistance levels: 0.6980, 0.7015, 0.7050, 0.7105, 0.7240, 0.7315, 0.7380, 0.7430, 0.7550, 0.7600
Trading recommendations
Sell Stop 0.6890. Stop-Loss 0.6960. Take-Profit 0.6865, 0.6845, 0.6800
Buy Stop 0.6960. Stop-Loss 0.6890. Take-Profit 0.6980, 0.7015, 0.7050, 0.7105, 0.7240, 0.7315, 0.7380, 0.7430, 0.7550, 0.7600


