Despite the 7-week decline, Brent crude oil maintains long-term positive price dynamics, trading above the key support level 64.40 (EMA200 and the lower line of the descending channel on the daily chart).
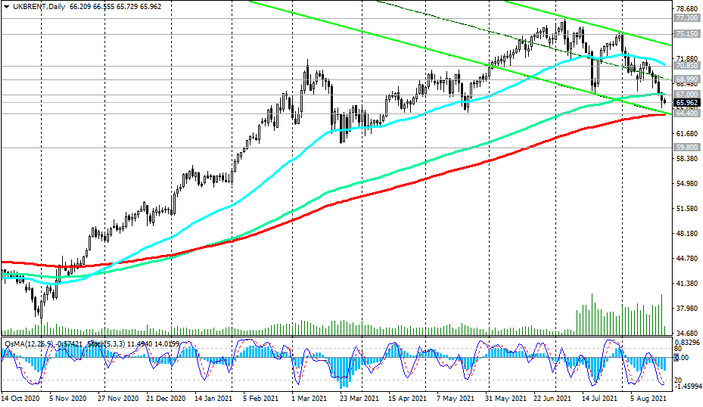
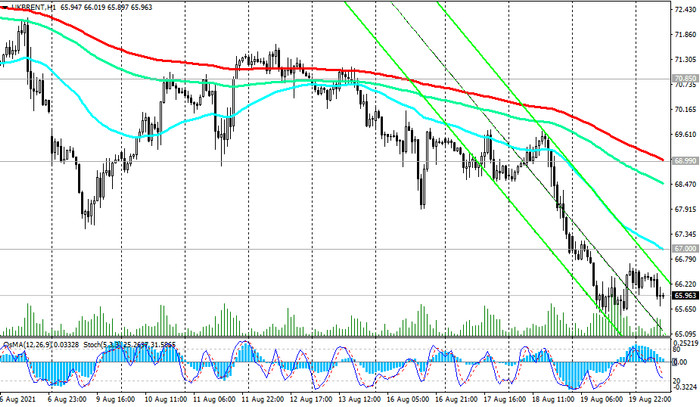
Therefore, it is logical to assume a price rebound near this support level. A return into the zone above the long-term level 67.00 (ЕМА144 on the daily chart) will create preconditions for the resumption of price growth, and the breakdown of the resistance levels 69.00 (ЕМА200 on the 1-hour chart), 70.85 (ЕМА50 on the daily chart) will become an additional confirmation signal for the resumption of buying.
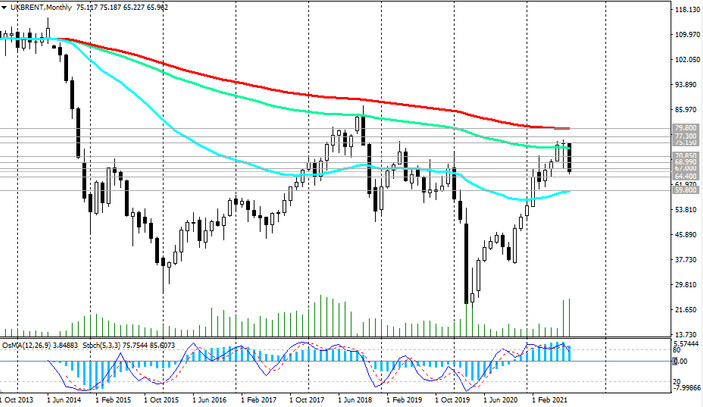
In an alternative scenario and in the event of a breakdown of the support levels 64.40 (ЕМА200 on the daily chart), 62.90 (Fibonacci level 23.6% of the correction to the wave of growth from record lows after the collapse of prices in March 2020), the decline may continue. A breakdown of the support level 59.80 (ЕМА200 on the weekly chart) will increase the negative dynamics and the likelihood of a return into a long-term downtrend.
Support levels: 64.40, 62.90, 59.80, 53.80
Resistance levels: 67.00, 69.00, 70.85, 75.15, 77.50
Trading recommendations
Sell Stop 64.90. Stop-Loss 67.30. Take-Profit 64.40, 62.90, 59.80, 53.80
Buy Stop 67.30. Stop-Loss 64.90. Take-Profit 68.00, 69.00, 70.85, 75.15, 77.50