
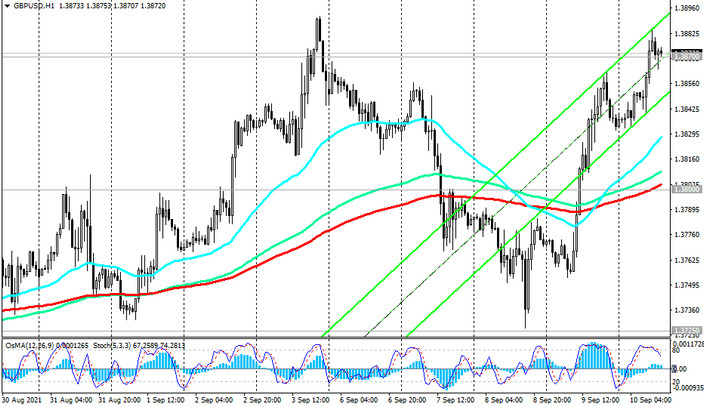
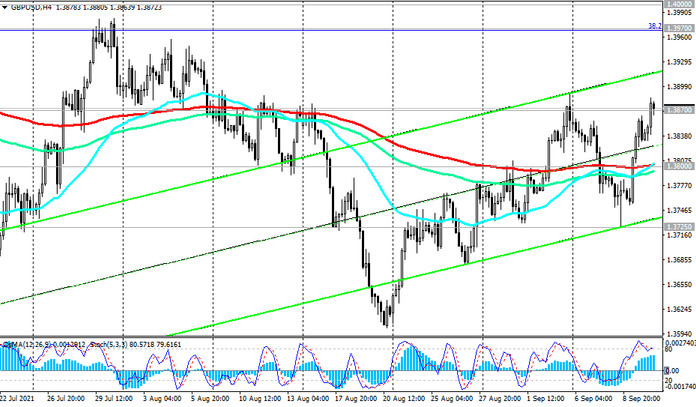
At the time of publication of this article, GBP / USD is traded just above 1.3870 mark, through which the upper border of the descending channel on the daily chart passes. GBP / USD continues to develop an upward trend in the bull market zone above the support levels 1.3800 (EMA144 on the daily chart, EMA200 on the 1-hour and 4-hour charts), 1.3725 (EMA200 on the daily chart).
Breakdown of resistance levels 1.3970 (Fibonacci level 38.2% of the correction to the decline of the GBP / USD pair in the wave that began in July 2014 near the level 1.7200), 1.4000 will become a signal for further growth towards the local resistance levels 1.4240 and 1.4300 (ЕМА144 at monthly chart).
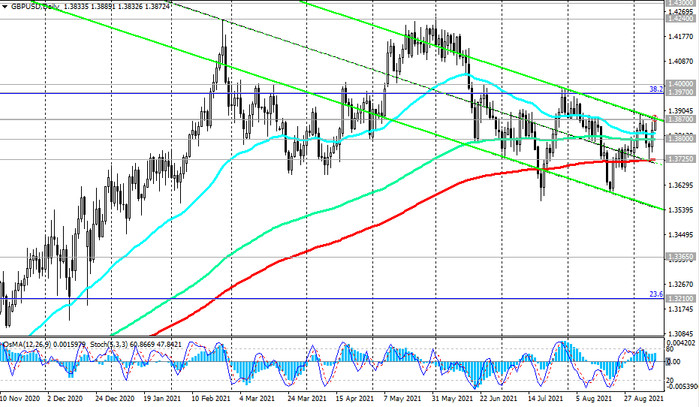
In an alternative scenario, GBP / USD will rebound from the level 1.3870 and resume its decline into the downward channel with intermediate targets at support levels 1.3800, 1.3725.
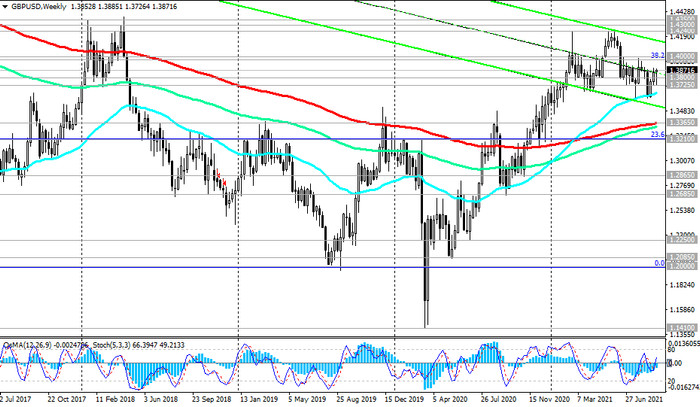
A break of the key support level 1.3365 (ЕМА200 on the weekly chart) will bring GBP / USD back to a long-term bear market.
Long positions are preferable in the current situation.
Support levels: 1.3800, 1.3725, 1.3600, 1.3365, 1.3210
Resistance levels: 1.3870, 1.3970, 1.4000, 1.4100, 1.4200, 1.4240, 1.4300, 1.4350, 1.4440, 1.4580, 1.4830
Trading recommendations
Sell Stop 1.3830. Stop-Loss 1.3910. Take-Profit 1.3800, 1.3725, 1.3600, 1.3365, 1.3210
Buy by-market, Buy Stop 1.3910. Stop-Loss 1.3830. Take-Profit 1.3970, 1.4000, 1.4100, 1.4200, 1.4240, 1.4300, 1.4350, 1.4440, 1.4580, 1.4830


