Against the backdrop of strong fundamental factors, the oil price broke through the upper border of the descending channel on the daily WTI chart on Wednesday and reached a local 6-week high near $ 72.87 per barrel. The strong upward momentum in the price remains despite the fact that the price has declined from yesterday's high and is currently close to 72.20 mark.
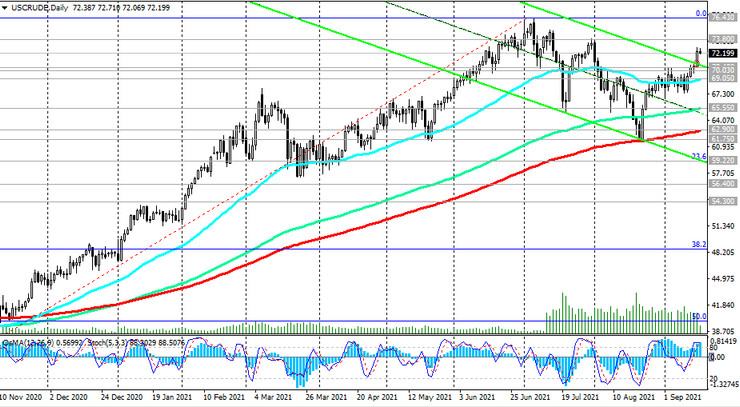
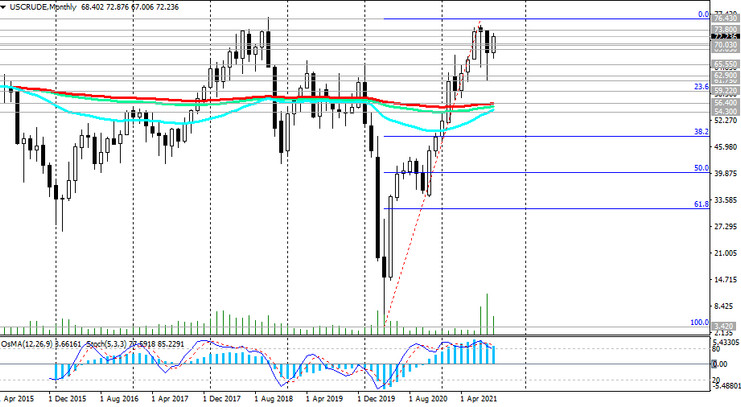
Growth is most likely to continue, and in case of a breakdown of the local resistance level 72.87, the price will go towards the multi-year high and the level 76.40 and, possibly, further within the ascending channel on the weekly chart, to its upper border, passing above the mark 80.00.
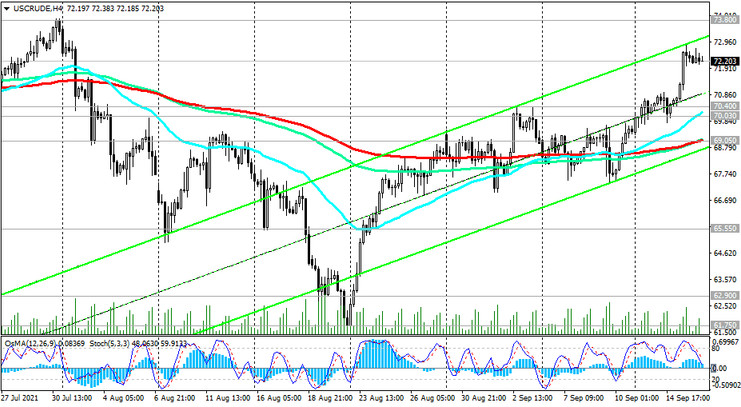
In an alternative scenario, the breakout of the support level 69.05 (ЕМА50 on the daily chart and ЕМА200 on the 4-hour chart) will be a signal to open short positions with targets near the key support level 62.90 (ЕМА200 on the daily chart).
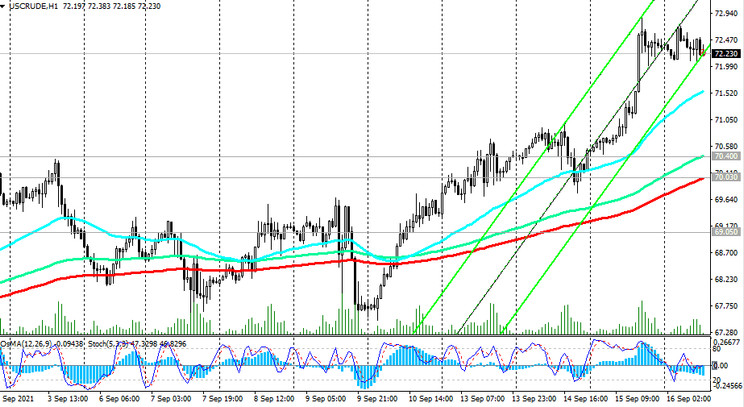
Further decline and a breakdown of the support level 54.30 (ЕМА200 on the weekly chart) will bring WTI oil back to the bear market. The first signal for the implementation of this scenario will be a breakdown of the short-term support level 70.03 (ЕМА200 on the 1-hour chart).
Support levels: 70.40, 70.03, 69.05, 65.55, 62.90, 61.75, 60.00, 59.22, 56.40, 54.30
Resistance levels: 72.87, 73.80, 75.00, 76.43
Trading recommendations
Sell Stop 71.50. Stop-Loss 72.90. Take-Profit 70.40, 70.03, 69.05, 65.55, 62.90, 61.75, 60.00, 59.22, 56.40, 54.30
Buy Stop 72.90. Stop-Loss 71.50. Take-Profit 73.80, 75.00, 76.43, 80.00