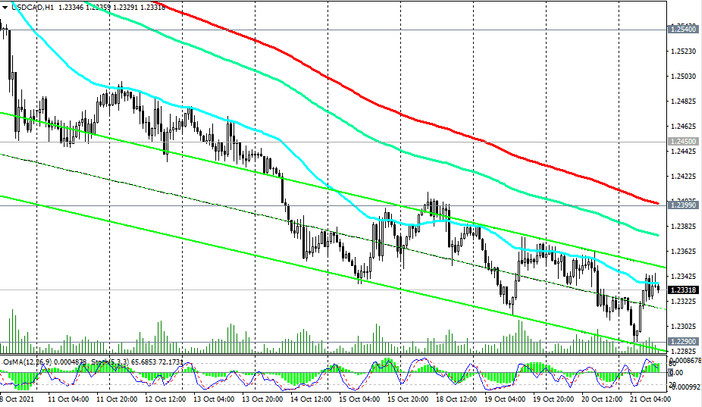
After the price broke through the key support levels 1.2590 (ЕМА200 on the daily chart), 1.2540 (ЕМА50, ЕМА144 on the daily chart) at the beginning of the month, today USD / CAD reached a new 17-week low of 1.2290. Although, at the beginning of today's European session, USD / CAD rose, rising to the level 1.2345, nevertheless, the downward trend remains. Below the key resistance levels 1.2450, 1.2540, 1.2590, 1.2900 USD / CAD remains in the bear market zone.
In case of a breakdown of the local support level 1.2290, USD / CAD will go inside the descending channel on the weekly chart and to the support level 1.1580 (Fibonacci level 61.8% of the downward correction in the wave of USD / CAD growth from 0.9700 to 1.4600) with an intermediate target at the local support level 1.2010.
In an alternative scenario and after returning into the zone above the resistance level 1.2450 (ЕМА200 on the monthly chart), USD / CAD may rise to the resistance levels 1.2540, 1.2590, and in case of their breakdown, develop an upward trend in the direction of resistance levels 1.2740 (Fibonacci level 38.2 %), 1.2900 (ЕМА200 on the weekly chart). Break of the resistance level 1.2900 will confirm the recovery of the bullish dynamics of USD / CAD. The first signal for the development of an alternative scenario will be a breakdown of the short-term resistance level 1.2399 (ЕМА200 on the 1-hour chart).
Support levels: 1.2290, 1.2165, 1.2010, 1.1580
Resistance levels: 1.2399, 1.2450, 1.2540, 1.2590, 1.2630, 1.2740, 1.2900
Trading scenarios
Sell Stop 1.2285. Stop-Loss 1.2370. Take-Profit 1.2200, 1.2165, 1.2010, 1.1580
Buy Stop 1.2370. Stop-Loss 1.2285. Take-Profit 1.2399, 1.2450, 1.2540, 1.2590, 1.2630, 1.2740, 1.2900