
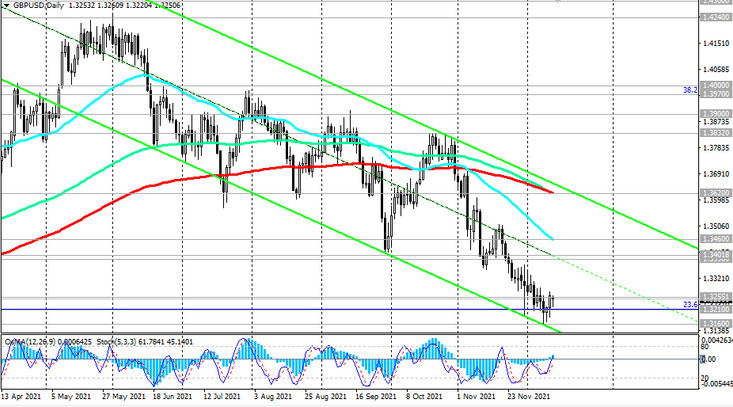
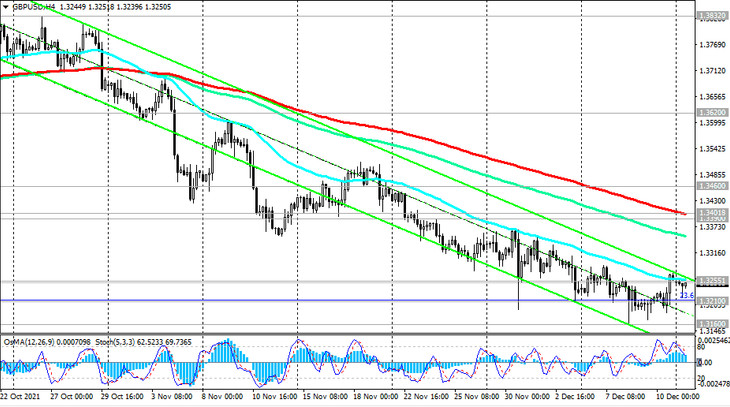
Last week the GBP / USD pair hit a new 13-month low near 1.3160 mark. Despite the fact that in the last few days the pair managed to grow slightly, bouncing from this local low, it remains in a downtrend, trading in the bear market zone, below the key resistance levels 1.3620 (ЕМА200, ЕМА144 on the daily chart), 1.3400 (ЕМА200 on weekly chart).
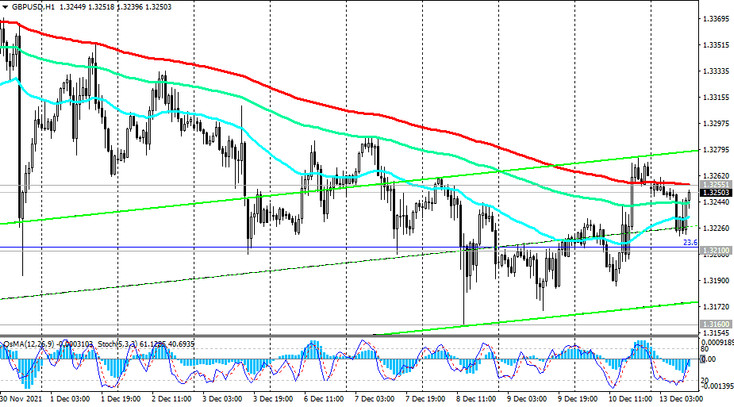
Meanwhile, on the 1-hour chart, the price came close to the important short-term resistance level 1.3255 (ЕМА200), while the technical indicators OsMA and Stochastic turned to long positions, signaling an upward correction.
A breakdown of this resistance level and the local resistance level 1.3270 may provoke further strengthening of the GBP / USD with the aim of rising at the resistance level 1.3400.
Further growth is unlikely, given the current monetary policy of the Fed and the Bank of England: downtrend prevails, the main driver of which is the strengthening of the dollar.
The most likely is a rebound from resistance levels 1.3270, 1.3255 and renewed decline in GBP / USD. A breakdown of the local support level 1.3160 will speed up this process.
Support levels: 1.3210, 1.3160, 1.3000, 1.2865, 1.2685
Resistance levels: 1.3255, 1.3400, 1.3460, 1.3620, 1.3700, 1.3832, 1.3900, 1.3970, 1.4000
Trading recommendations
Sell Stop 1.3230. Stop-Loss 1.3270. Take-Profit 1.3210, 1.3160, 1.3000, 1.2865, 1.2685
Buy Stop 1.3270. Stop-Loss 1.3230. Take-Profit 1.3400, 1.3460, 1.3620, 1.3700, 1.3832, 1.3900, 1.3970, 1.4000