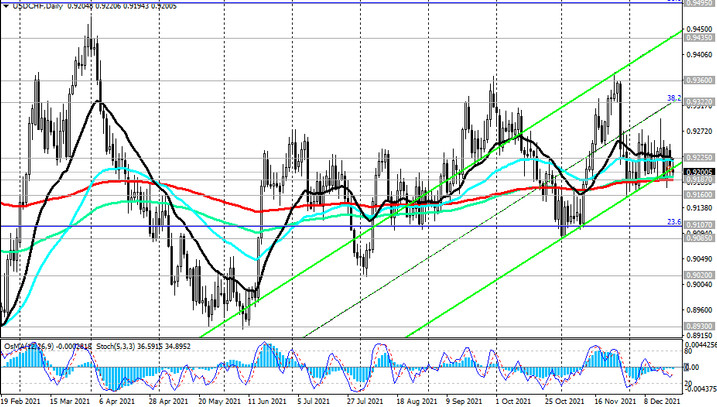
Since the beginning of this month, USD / CHF has been traded mostly in a range, remaining in the mid-term bull market zone, above the key support level 0.9187 (ЕМА200 on the daily chart).
At the time of publication of this article, USD / CHF is traded near the 0.9200 mark, dropping into the zone below the 0.9225 resistance level (ЕМА200 on the 1-hour and 4-hour charts, ЕМА50 on the daily charts) on positive macro statistics from Switzerland.
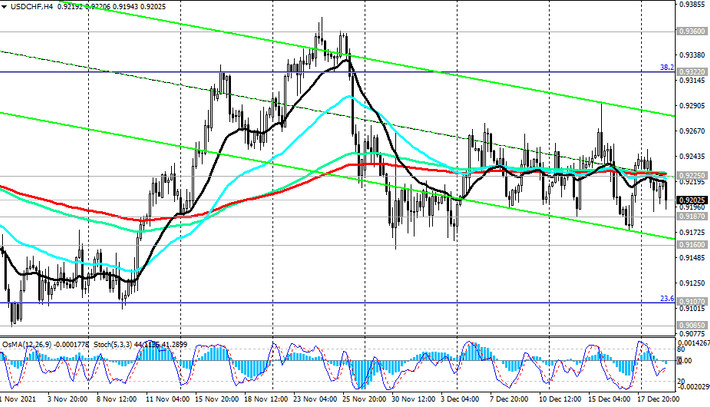
Nevertheless, long positions remain preferable, and in the event of a breakdown of the resistance level 0.9225, USD / CHF growth will continue with targets at resistance levels 0.9322 (Fibonacci level 38.2% of the correction to the decline wave that began in April 2019 near 1.0235), 0.9360 (ЕМА144 on the weekly chart and local highs). Breakdown of resistance levels 0.9435 (ЕМА200 on the weekly chart), 0.9495 (50% Fibonacci level) will indicate a return of USD / CHF to the long-term bull market zone.
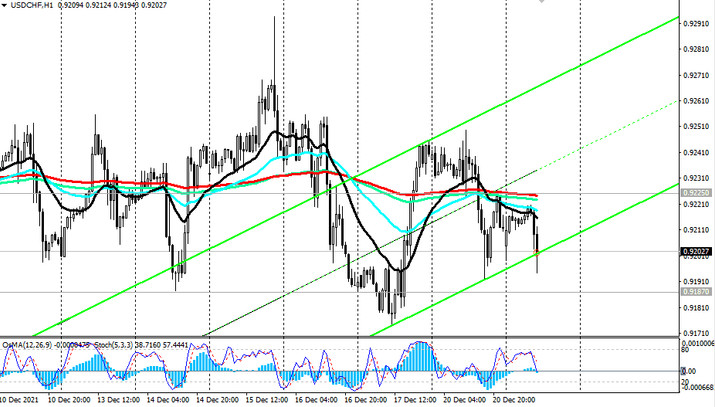
In an alternative scenario, the first signal for selling will be a breakdown of the key support level 0.9187, and a confirmation signal - a breakdown of the local support level 0.9160, which could push USD / CHF into a bear market zone.
In the current situation, the main scenario of further USD / CHF growth is preferable.
Support levels: 0.9187, 0.9160, 0.9107, 0.9085
Resistance levels: 0.9225, 0.9270, 0.9300, 0.9322, 0.9360, 0.9435, 0.9495, 0.9670
Trading scenarios
Sell Stop 0.9170. Stop-Loss 0.9255. Take-Profit 0.9160, 0.9107, 0.9085, 0.9000
Buy Stop 0.9255. Stop-Loss 0.9170. Take-Profit 0.9270, 0.9300, 0.9322, 0.9360, 0.9435, 0.9495, 0.9670