As we noted above, the USD/CHF pair has been trading in ranges since June last year, in a wider range between 0.9410 and 0.9000, and in a less wide range between 0.9360 and 0.9100. A kind of balance line here is EMA200 on the daily chart, which is currently passing through 0.9195 mark.
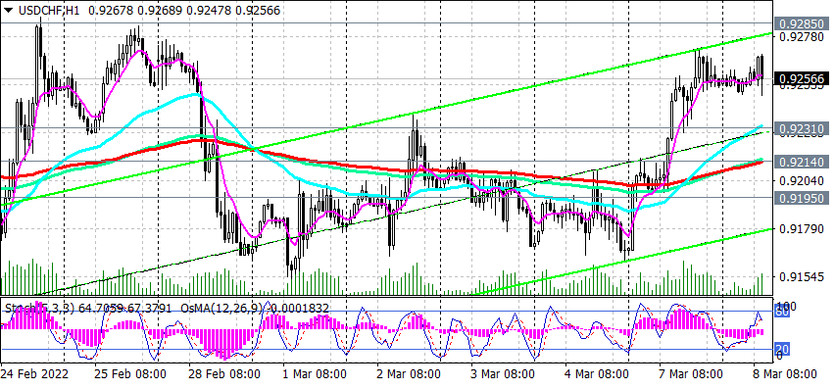
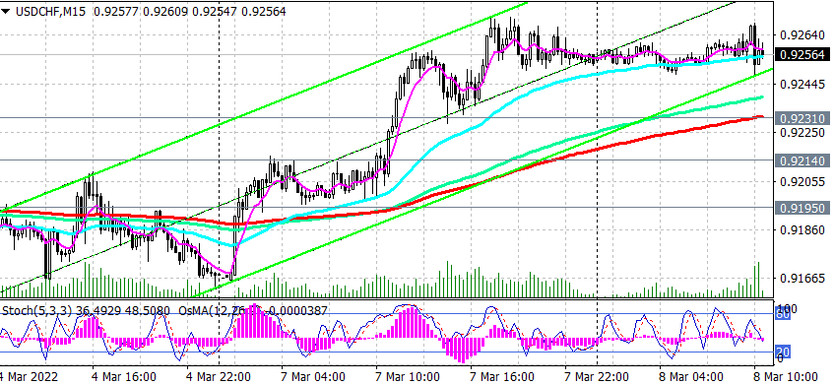
At the time of publication of this article, USD/CHF is traded near 0.9260 mark, staying above the important support levels 0.9214 (EMA200 on the 1-hour and 4-hour charts, EMA50 on the daily chart), 0.9195 (EMA200 on the daily chart).
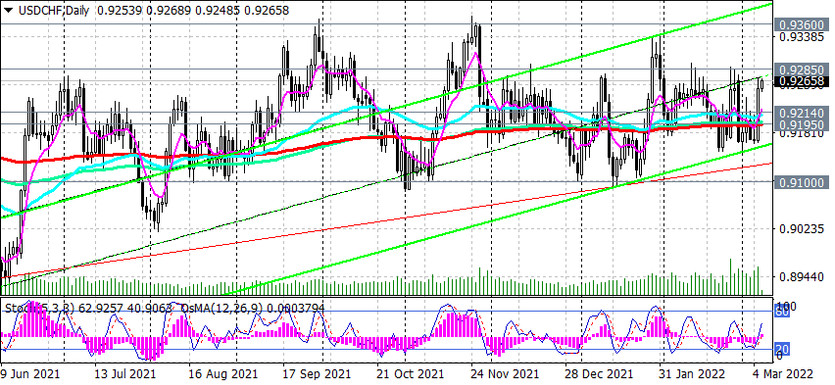
Above these support levels long positions remain preferable, and in the event of a breakdown of the resistance level 0.9285 (the upper limit of the range located between the levels 0.9100 and 0.9285), the growth of USD/CHF will continue with targets at the resistance levels 0.9360 (the upper limit of the range located between the levels 0.9360 and 0.9100), 0.9410 (EMA200 on the weekly chart). A breakdown of the resistance level 0.9410 will indicate the return of USD/CHF into the long-term bull market zone.
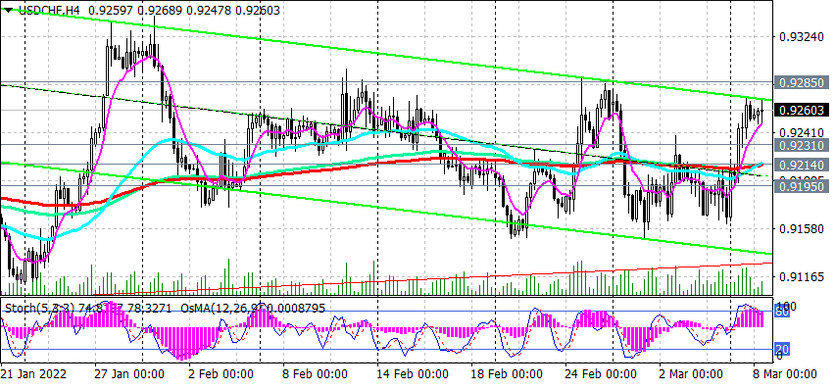
In an alternative scenario, the first sell signal will be a breakdown of the short-term support level 0.9231 (EMA200 on the 15-minute chart), and the confirming signal will be a breakdown of the support level 0.9214. Breakdown of the key support level 0.9195 may push USD/CHF into the bearish market.
In the current situation, the main scenario for further growth of USD/CHF is preferable. But - only after a confirmed breakdown of the resistance level 0.9285.
Support levels: 0.9231, 0.9214, 0.9195, 0.9150, 0.9100
Resistance levels: 0.9285, 0.9300, 0.9360, 0.9410
Trading recommendations
Sell Stop 0.9250. Stop Loss 0.9310. Take-Profit 0.9230, 0.9215, 0.9195, 0.9150, 0.9100, 0.9000
Buy Stop 0.9310. Stop Loss 0.9250. Take Profit 0.9360, 0.9400, 0.9470, 0.9500