

As we noted above, after a sharp fall during the previous week, today EUR/USD is growing for the second day in a row, developing upward dynamics towards the important short-term resistance level 1.1031 (EMA200 on the 1-hour chart).
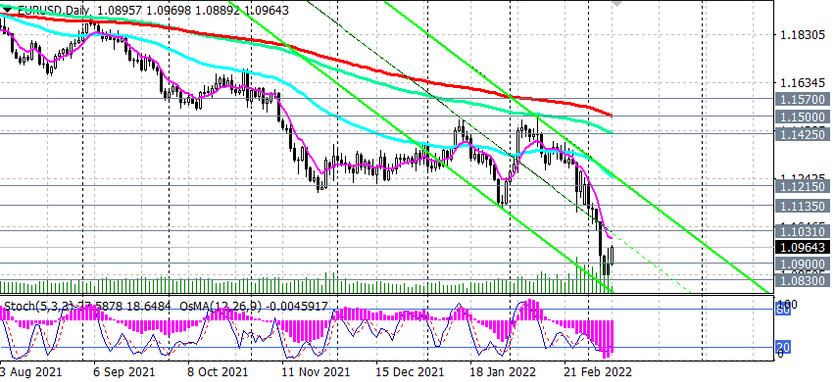
At the time of publication of this article, EUR/USD is traded near 1.0970 mark, in the zone of almost 2-year lows, below the key resistance levels 1.1570 (EMA200 on the weekly chart), 1.1500 (EMA200 on the daily chart).
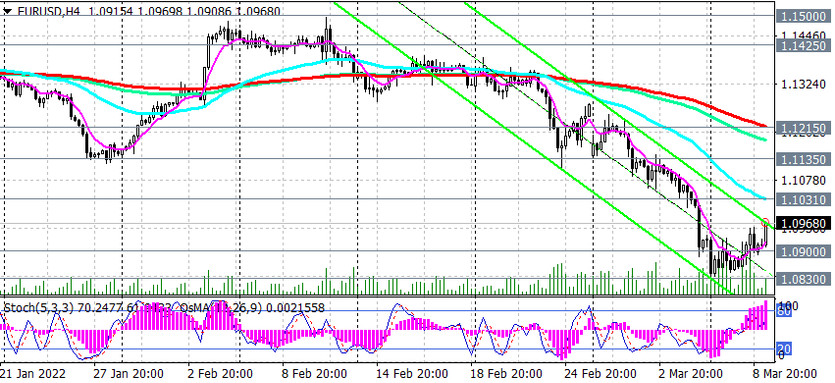
Technical indicators OsMA and Stochastic on the 1-hour, 4-hour, daily charts turned to long positions.
However, corrective growth will most likely be limited by the resistance level 1.1031. If the decline resumes, the targets will be the local support levels 1.0900 (lower line of the descending channel on the weekly chart), 1.0830 (local lows), 1.0700 (March 2000 lows).
In the alternative scenario, the corrective growth will continue towards resistance levels 1.1135 (local lows), 1.1215 (EMA200 on the 4-hour chart). However, in the current situation against the backdrop of fundamental data, the situation in Ukraine and in our main scenario, short positions remain preferable.
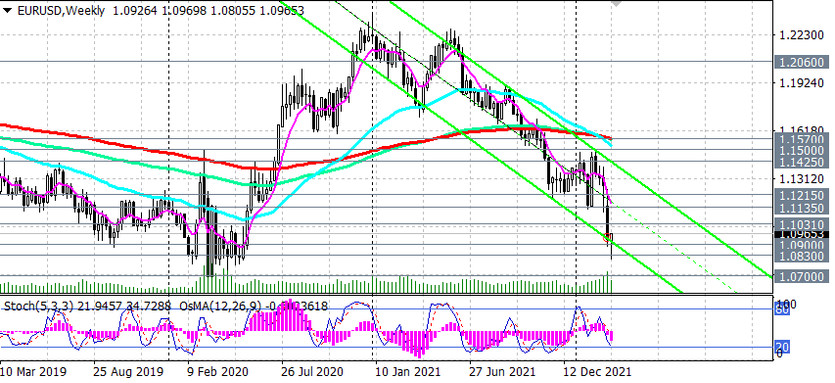
Only a breakdown of the long-term resistance level 1.1570 (EMA200 on the weekly chart) can return EUR/USD into the zone of the long-term bull market with the prospect of growth to the resistance level 1.2060 (EMA200 on the monthly chart).
Support levels: 1.0935, 1.0900, 1.0830, 1.0700
Resistance levels: 1.1031, 1.1135, 1.1215, 1.1300, 1.1400, 1.1425, 1.1500, 1.1570
Trading Recommendations
Sell Stop 1.0930. Stop Loss 1.1040. Take Profit 1.0900, 1.0830, 1.0700
Buy Stop 1.1040. Stop Loss 1.0930. Take-Profit 1.1100, 1.1135, 1.1215, 1.1300, 1.1400, 1.1425, 1.1500, 1.1570


