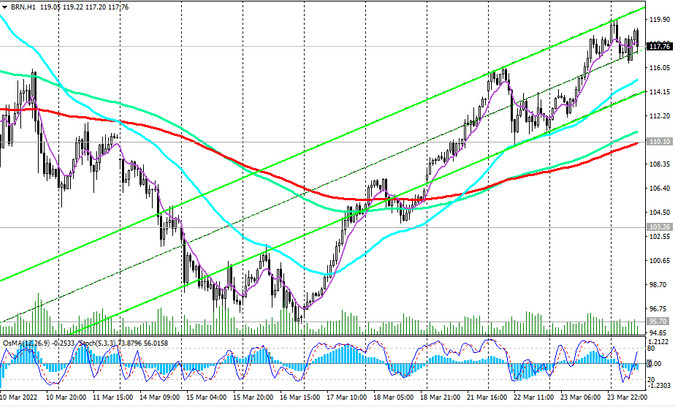
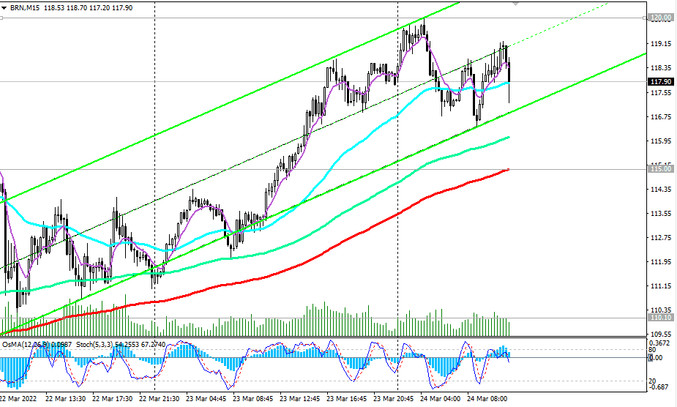
As we noted above, since the opening of today's trading day, Brent oil quotes have been rising again, touching the mark of $120.00 per barrel at the beginning of it.
Based on the tough fundamental background, we expect further price growth. From a technical point of view, a breakdown of the local resistance level 120.00 (today's maximum) may become a signal to enter long positions (or increase them). Rollback to short-term support levels 115.00 (EMA200 on 15-minute chart), 110.10 (EMA200 on 1-hour chart) can also be used to increase long positions.
The nearest growth target is 131.00 (a recent local and long-term maximum).
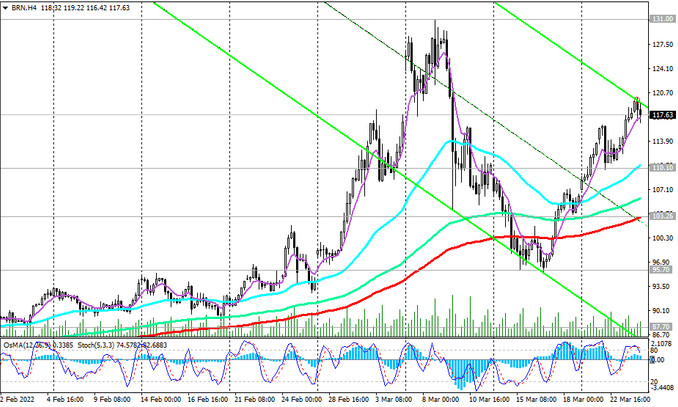
In an alternative scenario, and in case of a breakdown of the support level 110.10, the downward correction may continue to an important short-term support level 103.26 (EMA200 on the 4-hour chart), and after its breakdown, to the support levels 100.00, 95.70 (local lows).
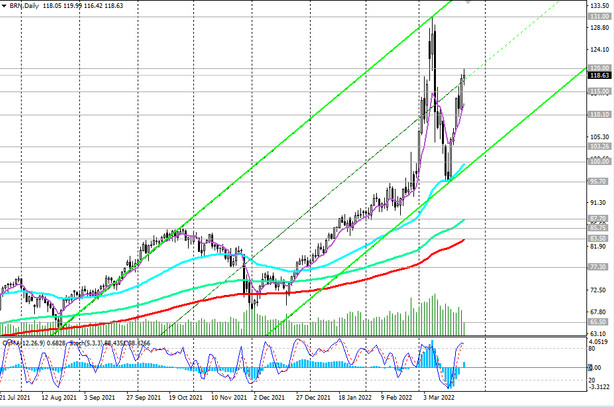
Breakdown of the key support level 83.50 (EMA200 on the daily chart) will increase the likelihood of further decline. But only a breakdown of the key support level 65.50 (EMA200 on the weekly chart) will return the price to the bearish market.
In our main scenario, prices will continue to rise, and aggressive buyers will probably find it possible to enter the market at current prices.
Support levels: 115.00, 110.10, 103.26, 100.00, 95.70, 87.70, 85.75, 83.50, 77.30, 65.50
Resistance levels: 120.00, 130.00, 131.00
Trading recommendations
Brent: Sell Stop 116.30. Stop Loss 120.10. Take-Profit 115.00, 110.10, 103.26, 100.00, 95.70, 88.00
Buy Stop 120.10. Stop Loss 116.30. Take-Profit 121.00, 122.00, 123.00, 124.00, 125.00, 126.00, 127.00, 128.00, 129.00, 130.00, 131.00