
At the time of writing this article, the XAU/USD pair is traded near the 1957.00 mark, remaining in the bull market zone. A strong upward momentum prevails. In the current situation, long positions look preferable. A signal to enter them may be a breakdown of the local resistance level 1965.00. However, the decline to short-term support levels 1949.00 (EMA200 on the 15-minute chart), 1942.00 (EMA200 on the 1-hour chart and the lower line of the ascending channel on the daily chart) provides additional opportunities to increase long positions.
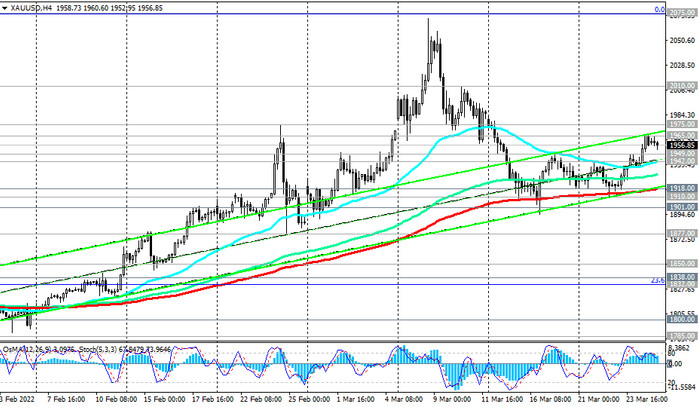
In an alternative scenario, the price will break through the support level 1942.00. In this case, the correction may continue to the support levels 1918.00 (EMA200 on the 4-hour chart), 1910.00 (local lows), 1901.00 (EMA50 on the daily chart). This decrease can probably also be used to increase long positions (near the support levels 1918.00, 1910.00, 1901.00).
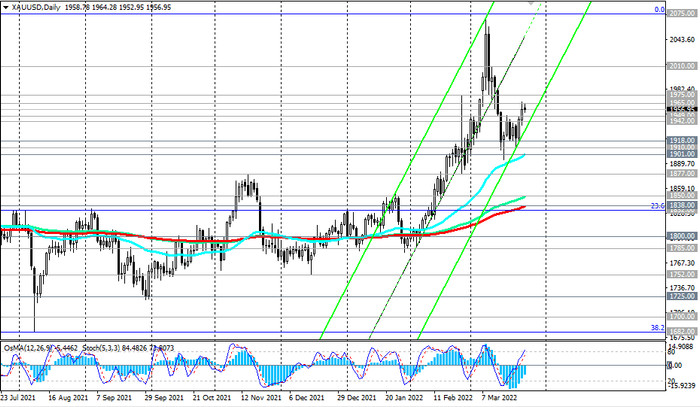
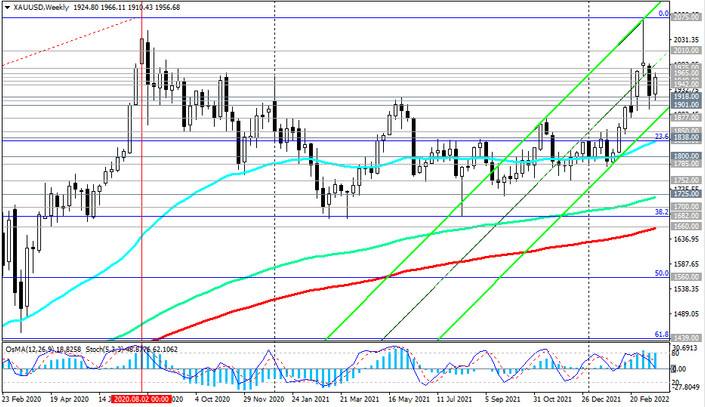
Above the key support level 1838.00 (EMA200 on the daily chart), XAU/USD remains in the long-term bull market zone. Only a breakdown of the support levels 1682.00 (Fibonacci level 38.2% of the correction to the growth wave since December 2015 and the mark of 1050.00), 1660.00 (EMA200 on the weekly chart) will increase the risks of breaking the long-term bullish trend of XAU/USD.
Support levels: 1949.00 1942.00 1918.00 1910.00 1901.00 1877.00 1850.00 1838.00 1832.00 1800.00 1785.00 1752.00
Resistance levels: 1965.00, 1975.00, 2000.00, 2010.00, 2070.00, 2075.00
Trading recommendations
Sell Stop 1935.00. Stop Loss 1966.00. Take-Profit 1918.00 1910.00 1901.00 1877.00 1850.00 1838.00 1832.00 1800.00 1785.00 1752.00 1725.00 1700.00 1682.00
Buy Limit 1950.00, 1945.00, Buy Stop 1966.00. Stop Loss 1935.00. Take-Profit 1975.00, 2000.00, 2010.00, 2070.00, 2075.00, 2100.00, 2200.00