
As we noted earlier, today the exchanges, including commodity ones, are closed. Trading in gold is not conducted. Yesterday's closing price of gold futures corresponds to 1972.50.
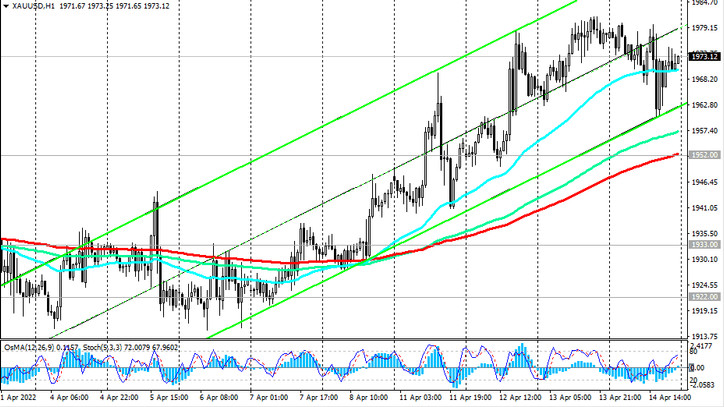
At the same time, XAU/USD remains in the bull market zone, moving in ascending channels on the daily and weekly charts. In the current situation, long positions look preferable. A signal to enter them may be a breakdown of the local resistance level 1981.00 (high of the week).
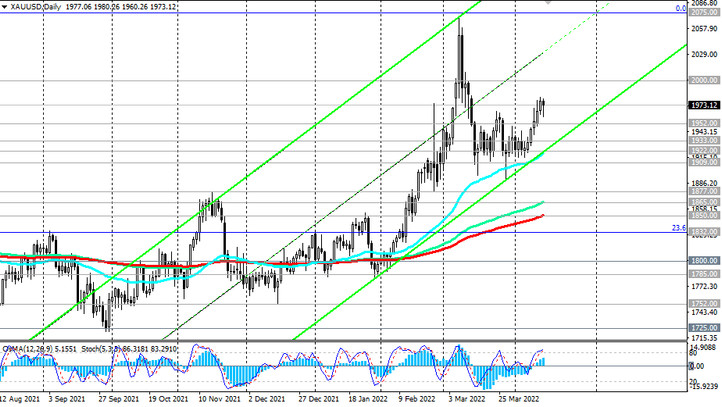
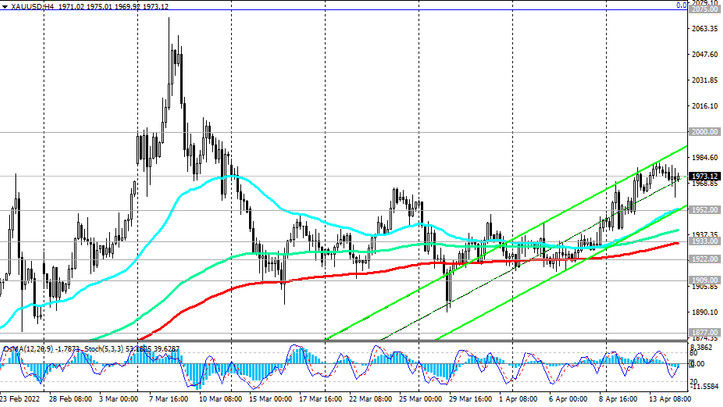
In an alternative scenario, and after the breakdown of the support level 1952.00 (EMA200 on the 1-hour chart), XAU/USD will fall to the support levels 1933.00 (EMA200 on the 4-hour chart) or 1922.00 (EMA50 and the lower line of the rising channel on the daily chart). Pending orders to buy can be placed near these levels. The first signal for the implementation of this scenario may be a breakdown of the local support level 1960.00.
Strong upward momentum prevails, making a deeper downward correction unlikely. In the current situation, investors perceive gold as a hedging and value store tool, protecting investments from many risks. The prevailing negative fundamental background on the market creates preconditions for further growth of gold quotes.
Support levels: 1952.00, 1933.00, 1922.00, 1909.00, 1900.00, 1877.00, 1865.00, 1850.00, 1832.00, 1800.00
Resistance levels: 1981.00, 2000.00, 2070.00, 2075.00, 2100.00
Trading recommendations
Sell Stop 1957.00. Stop Loss 1983.00. Take-Profit 1952.00, 1933.00, 1922.00, 1909.00, 1900.00, 1877.00, 1865.00, 1850.00, 1832.00, 1800.00
Buy Stop 1983.00. Stop Loss 1957.00. Buy Limit 1935.00, 1925.00, 1910.00. Stop Loss 1885.00. Take-Profit 2000.00, 2070.00, 2075.00, 2100.00