Having reached a local high of 0.8510 at the end of last month, EUR/GBP then moved to a decrease, returning to a long-term downtrend that began in January 2021.
Remaining in the area below the important long-term resistance levels 0.8450 (EMA200 on the daily chart), 0.8625 (EMA200, EMA144 on the weekly chart), EUR/GBP tends to further decline. Breakdown of the key support level 0.8145 (EMA200 on the monthly chart) will finally bring EUR/GBP into the zone of a long-term bear market.
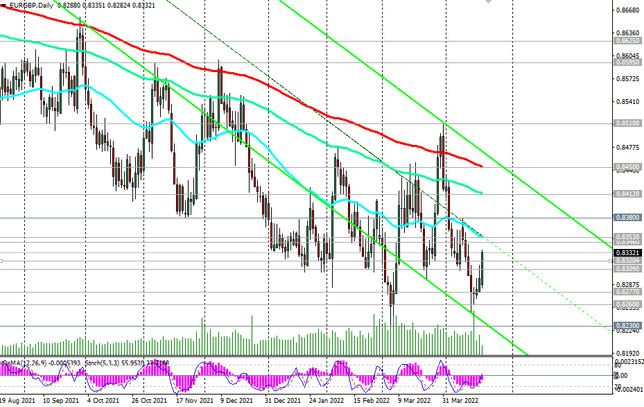
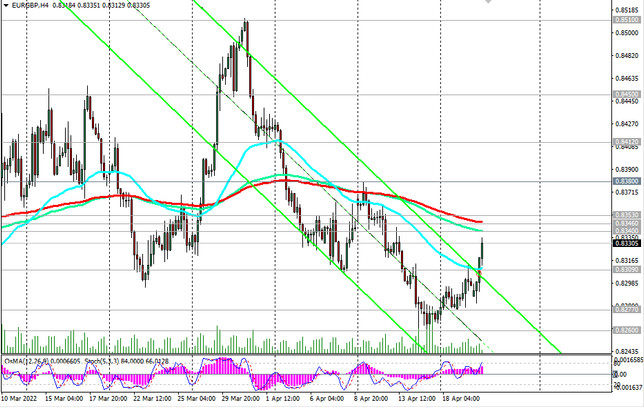
However, there is currently an upward correction after hitting a local 5-week low at 0.8249 last week. Since the pair remains under pressure below the key resistance levels 0.8412 (EMA144 on the daily chart), 0.8450, the current rise can be seen as an opportune moment to enter short positions, both "by-the market" and when reaching resistance levels 0.8340 (EMA144 on the 4-hour chart), 0.8346 (EMA200 on the 4-hour chart), 0.8353 (EMA50 on the daily chart).
For more cautious traders, a sell signal will be a breakdown of the support level 0.8309 (EMA200 on the 1-hour chart).
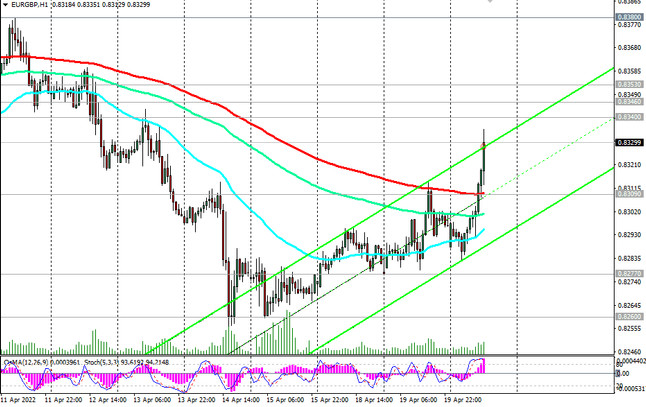
An alternative scenario and growth above the resistance level 0.8353, including against the backdrop of strong fundamental factors, is not yet considered.
Support levels: 0.8309, 0.8300, 0.8277, 0.8260, 0.8230, 0.8200, 0.8145
Resistance levels: 0.8340, 0.8346, 0.8353, 0.8380, 0.8400, 0.8412, 0.8450
Trading recommendations
Sell Limit 0.8340, 0.8346, 0.8353. Stop Loss 0.8385.
Sell Stop 0.8305. Stop Loss 0.8337. Take-Profit 0.8300, 0.8277, 0.8260, 0.8230, 0.8200, 0.8145