

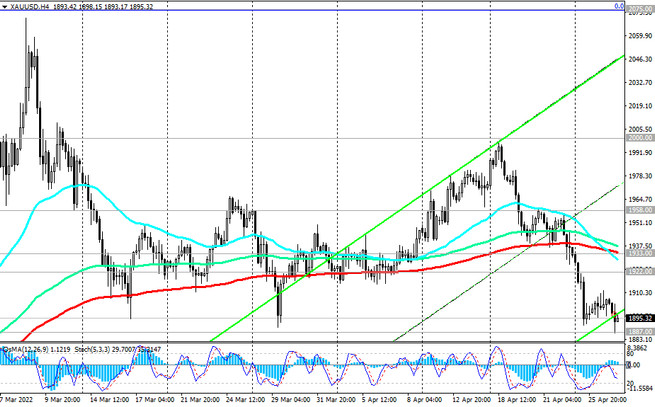
As of this writing, XAU/USD is traded near 1896.00, up from today's 9-week low 1887.00.
In our opinion, the current decline in quotations of this precious metal provides a good opportunity to open or increase long positions on it. The signal for the implementation of this scenario will be a breakdown of the local resistance level 1911.00. The next obstacle for the growth of XAU/USD will be the resistance levels 1922.00 (EMA50 on the daily chart), 1933.00 (EMA200 on the 4-hour chart).
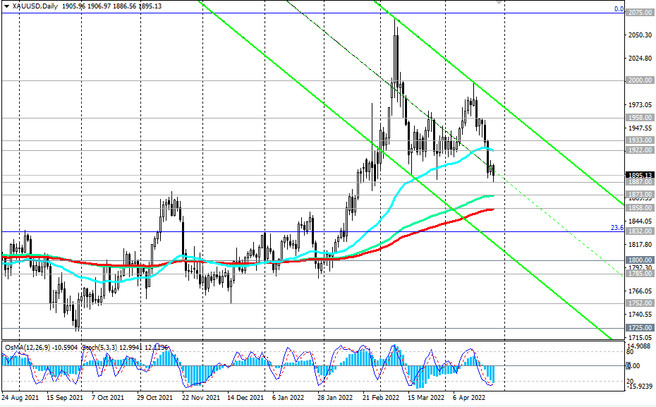
Further growth will bring the pair back inside the ascending channel on the weekly chart and direct it first towards the recent local highs 1958.00, 2000.00, and then - towards the multi-year high at 2075.00, reached last month.
In an alternative scenario, and after the breakdown of the local support level 1887.00, XAU/USD will fall to the support levels 1873.00 (EMA144 on the daily chart) or 1858.00 (EMA200 on the daily chart). New pending buy orders can be placed near these levels.
Despite the current decline, the upward momentum prevails. In the current situation, investors perceive gold as a hedging and value store tool, protecting investments from many risks, including accelerating inflation in the world. The negative fundamental background prevailing on the market creates the prerequisites for maintaining high demand for gold and the growth of its quotations.
Support levels: 1887.00, 1873.00, 1858.00, 1832.00, 1800.00
Resistance levels: 1911.00, 1922.00, 1933.00, 1958.00, 1965.00, 1975.00, 2000.00, 2010.00, 2070.00, 2075.00
Trading recommendations
Sell Stop 1885.00. Stop Loss 1913.00. Take-Profit 1873.00, 1858.00, 1832.00, 1800.00
Buy Stop 1913.00. Stop Loss 1885.00. Buy Limit 1875.00, 1865.00. Stop Loss 1850.00. Take-Profit 1922.00, 1933.00, 1958.00, 1965.00, 1975.00, 2000.00, 2010.00, 2070.00, 2075.00


