
After hitting a local high of 1.2913 at the beginning of this month, today USD/CAD is falling for the second day in a row, despite expectations regarding the outcome of the Fed meeting. It, as we remember, should end today with the publication (at 18:00 GMT) of the decision on the interest rate.
At the time of publication of this article, USD/CAD is near 1.2807, moving towards the nearest important support level 1.2786 (EMA200 on the 1-hour chart).
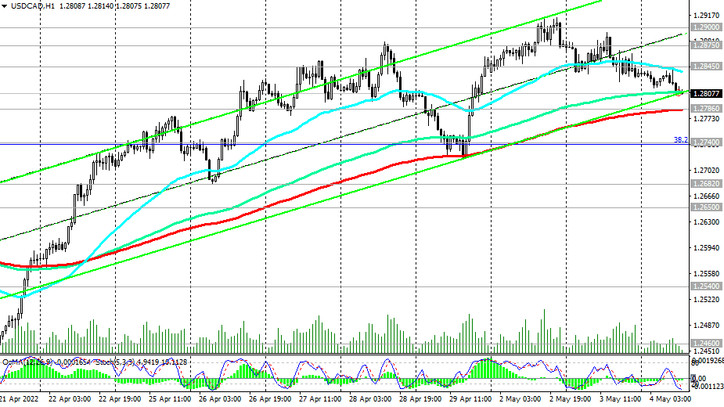
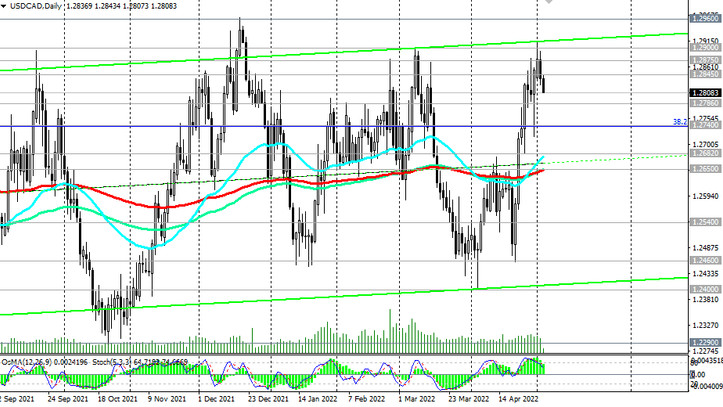
Its breakdown may strengthen the negative dynamics of USD/CAD and send it to the key support level 1.2650 (EMA200 on the daily chart), the breakdown of which, in turn, may provoke a deeper decline inside the descending channel on the weekly chart, the lower limit of which goes below 1.2400.
In an alternative scenario, USD/CAD will again try to break into the bull market zone above the resistance level 1.2845 (EMA200 on the weekly chart).
Growth into the zone above the local resistance level 1.2960 will confirm the return of USD/CAD into the zone of the long-term bull market.
Support levels: 1.2786, 1.2740, 1.2700, 1.2682, 1.2650, 1.2540, 1.2460, 1.2400, 1.2290, 1.2165, 1.2050, 1.2000
Resistance levels: 1.2845, 1.2875, 1.2900, 1.2960, 1.3000, 1.3100
Trading scenarios
Sell Stop 1.2775. Stop Loss 1.2855. Take-Profit 1.2740, 1.2700, 1.2682, 1.2650, 1.2540, 1.2460, 1.2400, 1.2290, 1.2165, 1.2050, 1.2000
Buy Stop 1.2855. Stop Loss 1.2775. Take-Profit 1.2875, 1.2900, 1.2960, 1.3000, 1.3100