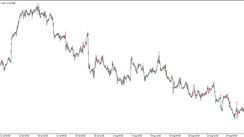
S&P 500 futures are down again. The failed upward correction sent the S&P 500 down again, below the lows of the previous month and below 4139.0, the July 2021 low.
The target of the fall of the S&P 500 is the support levels 3950.0 (the lower limit of the descending channel on the weekly chart), 3860.0 (EMA144 on the weekly chart).
A deeper correction will be associated with a decline to the key long-term support level 3640.0 (EMA200 on the weekly chart), the breakdown of which increases the risks of breaking the long-term long-term bullish trend of the S&P 500.
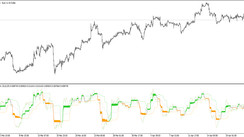
In an alternative scenario, and after the breakdown of the resistance level 4197.0 (EMA200 on the 1-hour chart), the S&P 500 will head towards the resistance levels of 4310.0 (local highs), 4325.0 (EMA200 on the 4-hour chart).
Above the resistance level of 4390.00, long positions will become preferable again.
Support levels: 4000.0, 3950.0, 3900.0, 3860.0, 3800.0, 3700.0, 3610.0
Resistance levels: 4140.0, 4197.0, 4310.0, 4325.0, 4365.0, 4390.0
Trading recommendations
Sell Stop 4035.0. Stop Loss 4110.0. Targets 4000.0, 3950.0, 3900.0, 3860.0, 3800.0, 3700.0, 3610.0
Buy Stop 4110.0. Stop Loss 4035.0. Targets 4140.0, 4197.0, 4310.0, 4325.0, 4365.0, 4390.0