
At the time of writing this article, XAU/USD is traded near 1821.00, falling for the second day in a row today. XAU/USD is actively declining after hitting a multi-year high of 2070.00 in March.
At the beginning of this week, the price broke through the important long-term support level 1857.00 (EMA200 on the daily chart) and is moving towards the levels 1800.00 and 1785.00, near which the lower border of the descending channel on the daily chart passes. Probably, these marks will become the nearest targets if XAU/USD continues to fall.
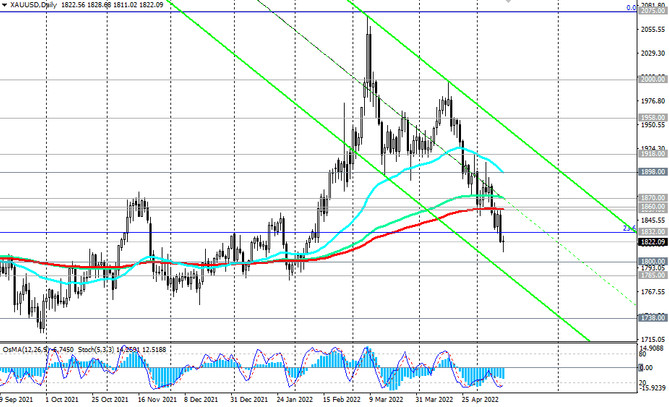
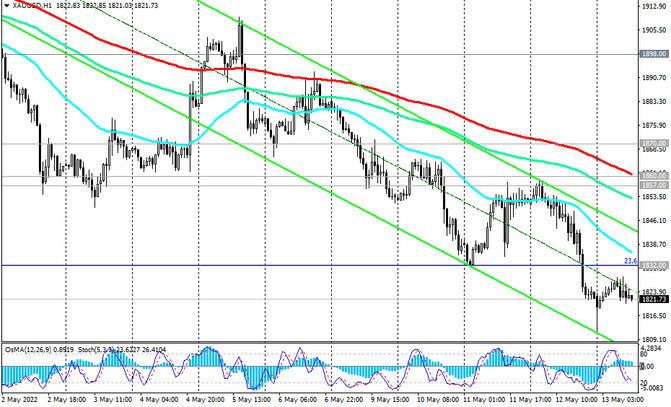
In an alternative scenario, and in case of renewed weakening of the dollar, XAU/USD will resume growth and head towards the level 1857.00, the breakdown of which will mean a return to the bull market zone. A break of the resistance level 1870.00 (EMA144 on the daily chart) will confirm its recovery. The signal for the implementation of this scenario will be a breakdown of the resistance level 1832.00 (local highs and the Fibonacci level of 23.6% correction to the growth wave from December 2015 and the mark of 1050.00).
Support levels: 1800.00, 1785.00, 1738.00, 1700.00, 1682.00, 1675.00
Resistance levels: 1832.00, 1857.00, 1860.00, 1870.00, 1898.00, 1918.00, 1958.00, 2000.00, 2070.00, 2075.00
Trading recommendations
Sell Stop 1809.00. Stop Loss 1834.00. Take-Profit 1800.00, 1785.00, 1738.00, 1700.00, 1682.00, 1675.00
Buy Stop 1834.00. Stop Loss 1809.00. Take-Profit 1857.00, 1860.00, 1870.00, 1898.00, 1918.00, 1958.00, 2000.00, 2070.00, 2075.00