
The intrigue in the actions of the US and Canadian central banks continues, increasing the volatility in the dynamics of USD/CAD and also creating a lot of trading opportunities.
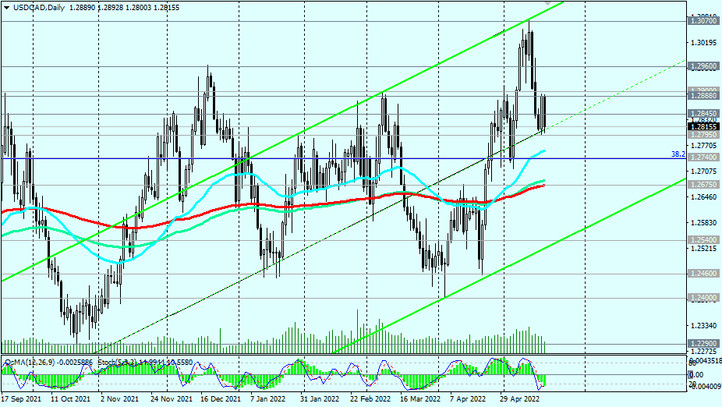
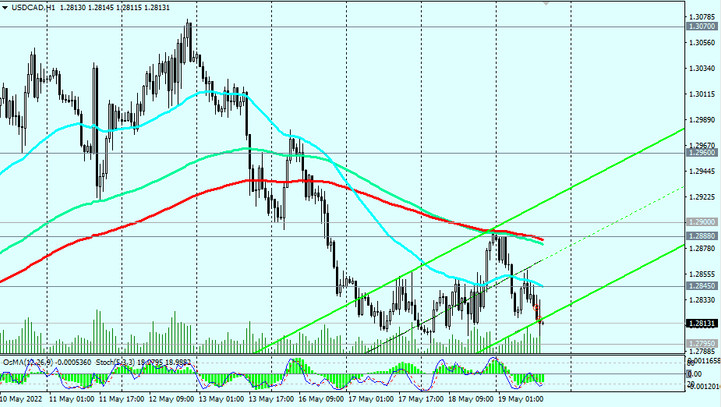
From a technical point of view, a break below the key support level 1.2845 (EMA200 on the weekly chart) will open the way for USD/CAD to further decline inside the downward channel on the weekly chart. Its lower border is currently passing near 1.2700. In the future, a break of the support level 1.2765 (local lows and ЕМА200 on the 4-hour chart) will become a signal for the resumption of short positions.
In an alternative scenario, a signal for buying will be a breakdown of resistance levels 1.2888 (EMA200 on the 1-hour chart), 1.2900 (local resistance level).
A break into the zone above the local resistance levels 1.2960, 1.3070 will finally bring USD/CAD into the zone of a long-term bull market.
Support levels: 1.2795, 1.2740, 1.2675, 1.2600, 1.2540, 1.2460, 1.2400, 1.2290, 1.2165, 1.2010, 1.2000
Resistance levels: 1.2845, 1.2888, 1.2900, 1.2960, 1.3000, 1.3070, 1.3100
Trading recommendations
Sell Stop 1.2785. Stop Loss 1.2870. Take-Profit 1.2740, 1.2675, 1.2600, 1.2540, 1.2460, 1.2400, 1.2290, 1.2165, 1.2010, 1.2000
Buy Stop 1.2870. Stop Loss 1.2785. Take-Profit 1.2888, 1.2900, 1.2960, 1.3000, 1.3070, 1.3100