
At the time of publication of this article, AUD/USD is traded near 0.7138, developing an upward correction to the resistance level 0.7165 (EMA50 on the daily chart). Meanwhile, AUD/USD remains in the bear market zone, trading below key resistance levels 0.7600 (EMA200 on the monthly chart), 0.7310 (EMA200 on the weekly chart), 0.7270 (EMA200 on the daily chart).
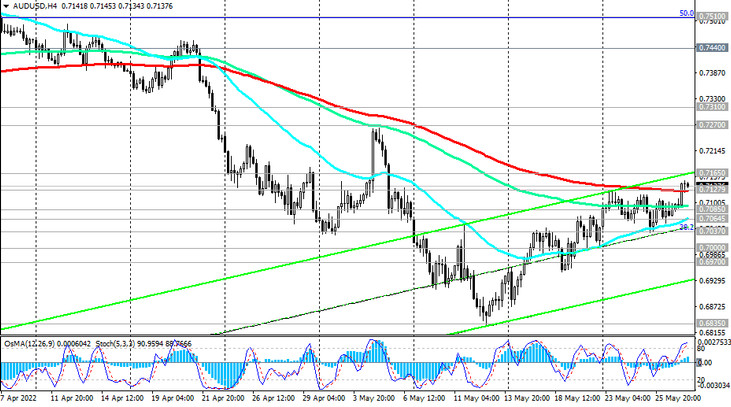
A breakdown of support levels 0.7128 (EMA200 on the 4-hour chart), 0.7064 (EMA200 on the 1-hour chart) will resume the downward dynamics of AUD/USD.
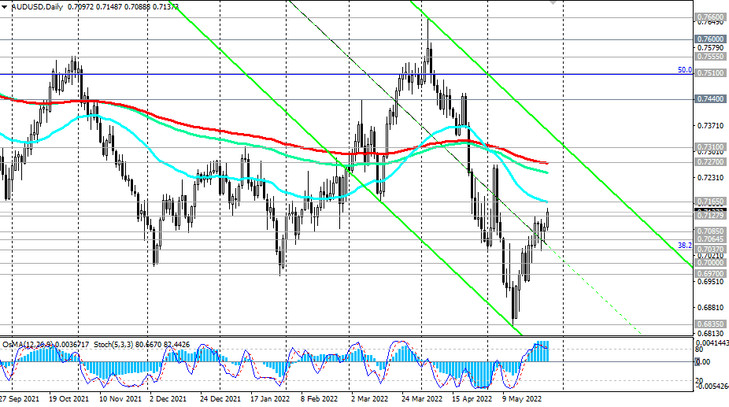
In an alternative scenario, AUD/USD will again attempt to grow towards the resistance levels 0.7270, 0.7310. The signal for the development of this scenario will be a breakdown of the resistance level 0.7165. Below this resistance level, short positions in AUD/USD remain preferable.

Support levels: 0.7128, 0.7085, 0.7064, 0.7037, 0.7000, 0.6970, 0.6800, 0.6450
Resistance levels: 0.7165, 0.7200, 0.7270, 0.7310, 0.7400, 0.7440, 0.7510, 0.7555, 0.7615, 0.7660
Trading Recommendations
Sell Stop 0.7120. Stop Loss 0.7175. Take-Profit 0.7085, 0.7064, 0.7037, 0.7000, 0.6970, 0.6800, 0.6450
Buy Stop 0.7175. Stop Loss 0.7120. Take-Profit 0.7200, 0.7270, 0.7310, 0.7400, 0.7440, 0.7510, 0.7555, 0.7615, 0.7660