

At the time of writing this article, AUD/USD is traded near 0.7186 mark, just above important support levels 0.7156 (EMA200 on the 4-hour chart), 0.7180 (EMA200 on the 1-hour chart, EMA50 on the daily chart).
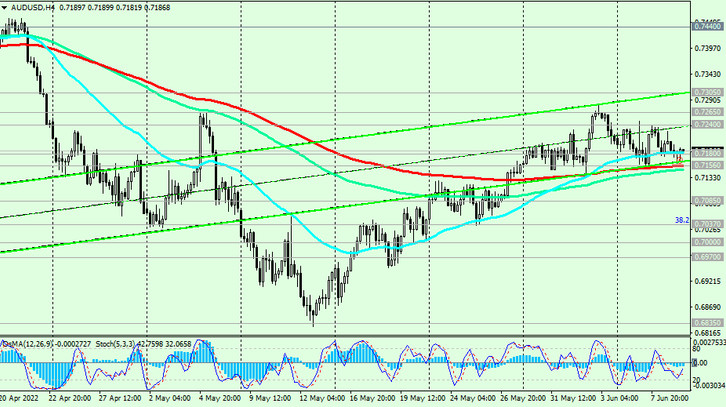
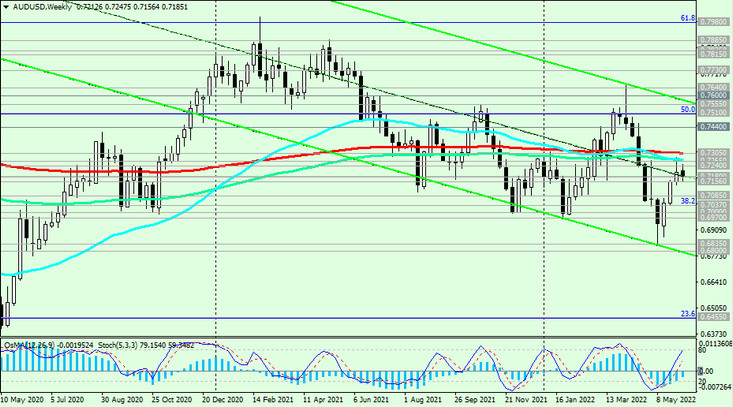
From a technical point of view, a breakdown of these support levels will trigger a further decline in AUD/USD inside the descending channels on the daily and weekly charts and to the marks of 0.6835, 0.6800 with intermediate targets at the support levels 0.7085, 0.7037 (Fibonacci 38.2% of the correction to the decline wave pairs from 0.9500 in July 2014 to 2020 lows near 0.5510), 0.7000, 0.6970, 0.6900.
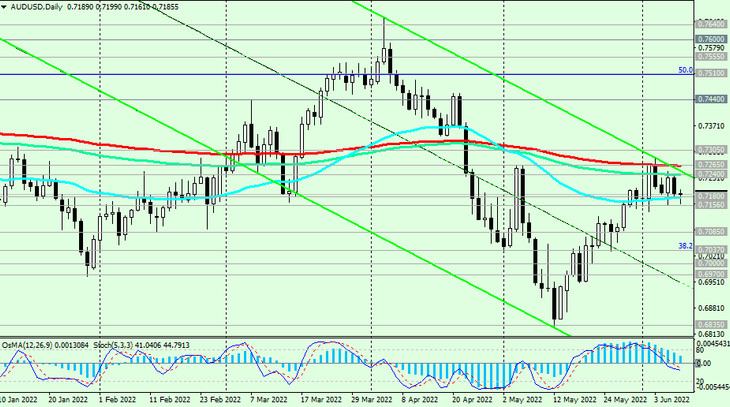
In an alternative scenario, AUD/USD will again try to break through the key resistance levels 0.7265 (EMA200 on the daily chart), 0.7240 (EMA144 on the daily chart), 0.7305 (EMA200 on the weekly chart, EMA50 on the monthly chart). A breakdown of the resistance levels 0.7600 (EMA200 on the monthly chart), 0.7640 (EMA144 on the monthly chart) will bring AUD/USD into the zone of a long-term bull market.
Support levels: 0.7180, 0.7156, 0.7085, 0.7037, 0.7000, 0.6970, 0.6835, 0.6800, 0.6450
Resistance levels: 0.7200, 0.7240, 0.7265, 0.7305, 0.7400, 0.7440, 0.7510, 0.7555, 0.7600, 0.7640
Trading Recommendations
Sell Stop 0.7150. Stop Loss 0.7220. Take-Profit 0.7100, 0.7085, 0.7037, 0.7000, 0.6970, 0.6835, 0.6800, 0.6450
Buy Stop 0.7220. Stop Loss 0.7150. Take-Profit 0.7240, 0.7265, 0.7305, 0.7400, 0.7440, 0.7510, 0.7555, 0.7600, 0.7640


