As we noted above, today the GBP/USD is falling again, while the dollar and the DXY dollar index resumed growth.
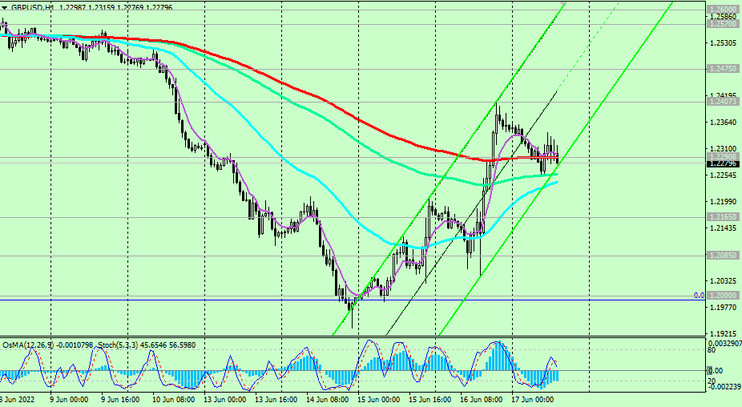
At press time, the GBP/USD is traded near 1.2280, testing for a breakdown of the important short-term support at 1.2290 (EMA200 on the 1-hour chart). In case of its successful breakdown, the GBP/USD will head towards the lower border of the descending channel on the weekly chart and towards the marks of 1.2085, 1.2000.
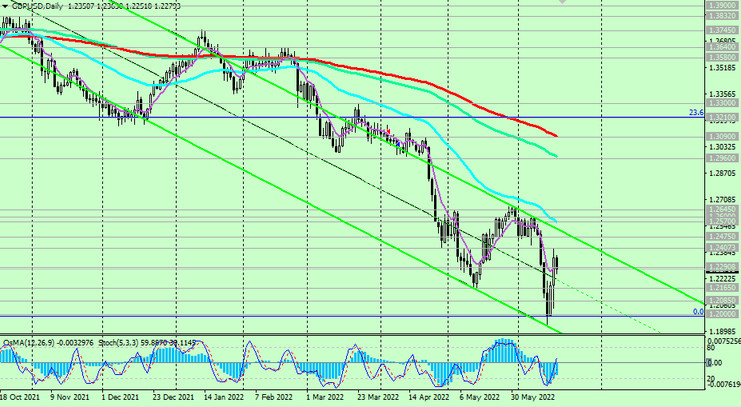
The breakdown of the local minimum of 1.1934, reached earlier this week, will increase the risks of further fall of the GBP/USD.
In an alternative scenario, the GBP/USD will again attempt an upward correction, and the signal that creates the possibility of further growth will be the price fixing above the level of 1.2290, then - above yesterday's high of 1.2405.
In the meantime, short positions on GBP/USD remain preferable.
Support levels: 1.2290, 1.2200, 1.2165, 1.2100, 1.2085, 1.2000
Resistance levels: 1.2300, 1.2407, 1.2475, 1.2500, 1.2570, 1.2600, 1.2645, 1.2700, 1.2960, 1.3090, 1.3100, 1.3140, 1.3210, 1.3300
Trading recommendations
Sell Stop 1.2250. Stop Loss 1.2370. Take-Profit 1.2200, 1.2165, 1.2100, 1.2085, 1.2000
Buy Stop 1.2370. Stop Loss 1.2250. Take-Profit 1.2407, 1.2475, 1.2500, 1.2570, 1.2600, 1.2645, 1.2700, 1.2960, 1.3090, 1.3100, 1.3140, 1.3210, 1.3300