
As we noted above, despite the current upward correction, in general, the negative dynamics of the S&P 500 remains.
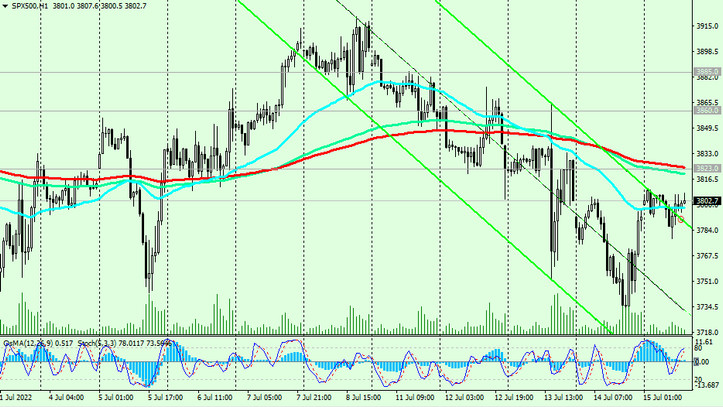
The breakdown of today's low of 3778.00 and the local support level 3740.00 will be a signal for the resumption of short positions, and the breakdown of the key support level 3660.00 (EMA200 on the weekly chart) - for their increase.
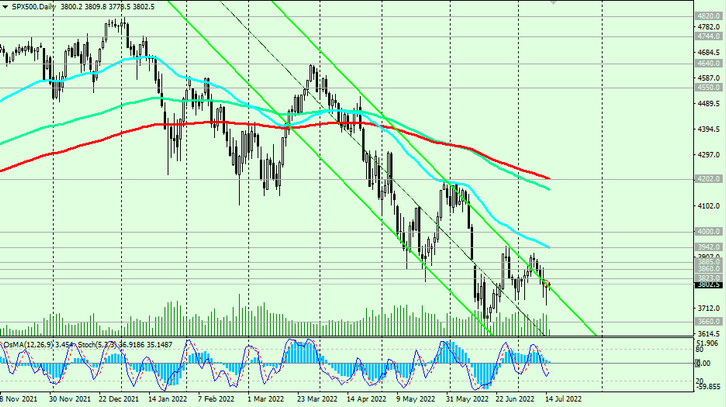
In this case, the S&P 500 will move into the zone of a long-term bear market, and the decline targets will be the key support levels 2705.00 (EMA144 on the monthly chart), 2428.00 (EMA200 on the monthly chart).
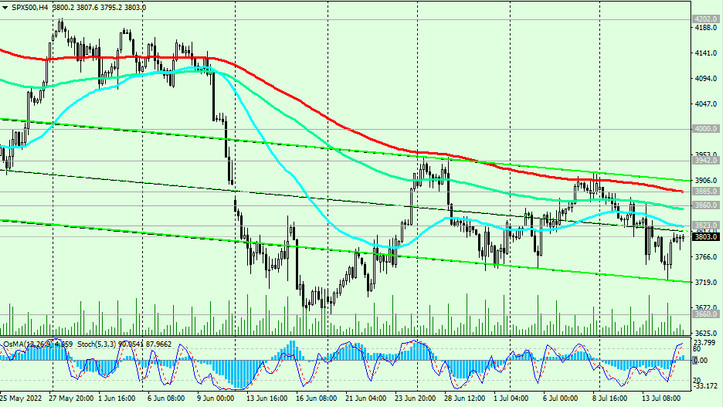
In an alternative scenario, a break through the resistance levels 3823.00 (EMA200 on the 1-hour chart), 3860.00 (EMA144 on the weekly chart) may provoke further corrective growth to the resistance levels 3885.00 (EMA200 on the 4-hour chart), 3942.00 (EMA50 on the daily chart).
In any case, growth above the key resistance level 4202.00 (EMA200 on the daily chart, EMA50 and the upper line of the downward channel on the weekly chart) should not be expected yet: the negative dynamics of the S&P 500 continues.
Support levels: 3740.00, 3700.00, 3660.00
Resistance levels: 3800.00, 3823.00, 3860.00, 3885.00, 3942.00, 4000.00, 4202.00
Trading recommendations
Sell Stop 3776.00. Stop Loss 3826.00. Targets 3740.00, 3700.0, 3660.00
Buy Stop 3826.00. Stop Loss 3776.00. Targets 3860.00, 3885.00, 3942.00, 4000.00, 4202.00