
S&P 500 yesterday broke through the strong resistance level 4139.00 (EMA144 on the daily chart) and today came close to the key long-term resistance level 4180.00 (EMA200 on the daily chart, EMA50 on the weekly chart).
A breakdown of this resistance level will renew the S&P 500's long-term upward momentum, returning it to the multi-year bull market zone.
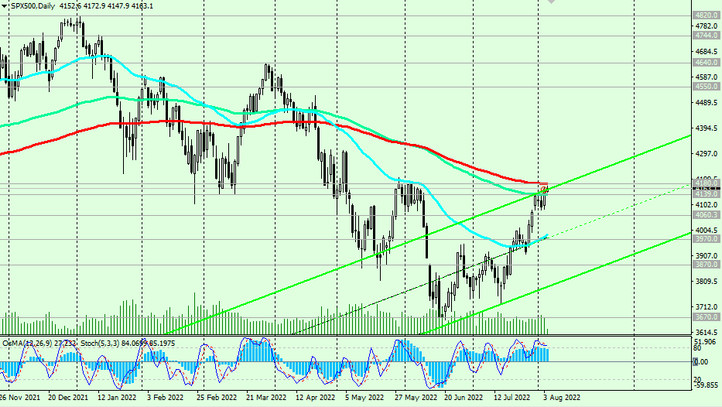
In this case, the S&P 500 will head towards the all-time highs near 4820.00 hit earlier this year, which would also signal a full recovery of the S&P 500's multi-year bull run.
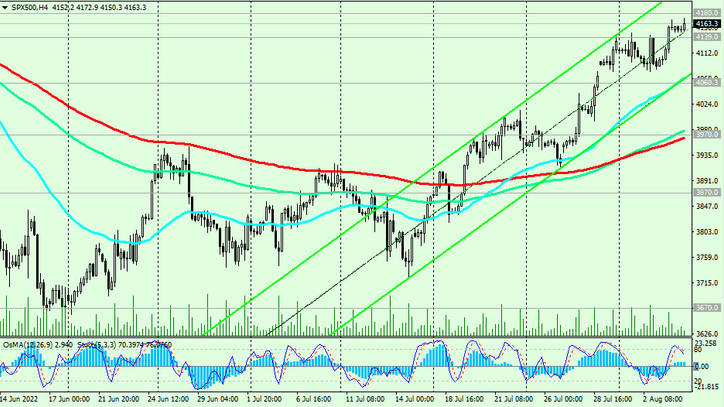
In an alternative scenario, and after the breakdown of the support level 3970.00 (EMA200 on the 4-hour chart, EMA50 on the daily chart), the S&P 500 will again head to the key long-term support level 3670.00 (EMA200 on the weekly chart). Its breakdown could finally break the long-term global bullish trend of the S&P 500.
Support levels: 4139.00, 4060.00, 3970.00, 3870.00, 3670.00, 3600.00
Resistance levels: 4180.00, 4550.00, 4630.00, 4820.00
Trading recommendations
Sell Stop 4075.00.00. Stop Loss 4185.00. Targets 4060.00, 3970.00, 3870.00, 3670.00, 3600.00
Buy Stop 4185.00. Stop Loss 4075.00. Targets 4200.00, 4300.00, 4400.00, 4550.00, 4630.00, 4820.00