We often hear that we should not plot too many lines and/or indicators on our charts when we trade Forex. This advice and the reasons cited behind it are certainly valid.
In fact, paralysis by analysis is a common but hidden obstacle that many traders face toward achieving long-term success in Forex. Statistically, it has been shown over the years that the traders who are most successful are masters only at a few technical tools and beyond that they don’t even look at other technical indicators - let alone take trades based on them. And, there are even many continuously profitable Forex traders who use nothing but price action.
Why less is more?
Taking the path that the more you learn about technical analysis and the more indicators you learn to use will lead to more success is a fallacy that will likely result in a waste of time and money. As a matter of fact, it’s quite the opposite. The more you learn about technical and charting tools the more confused you will probably get and the less you will progress. This is because all technical indicators essentially show the same thing and they are all based on exactly the same data – the price.
So, when you try to trade with 3 different oscillators and 4 different trend indicators they will all show you the same thing but in a slightly different way. This leads to many confusing signals being generated by the indicators which can result in nothing but confusion for the trader as well. Make no mistake, those indicators would be valuable when used by themselves but it becomes a problem when you try to use them all together. That’s when paralysis by analysis begins to bite into the trader’s results.
Those that try to learn and to use too many indicators are actually more likely to see their results stagnating over time. Instead of their results improving as they are learning more and more about indicators and technical analysis, much to their surprise, they see that not only their results aren’t improving but they have actually started declining.
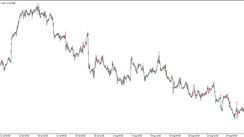
As they say, an image is worth a thousand words, so below we show how the charts of some traders look like.
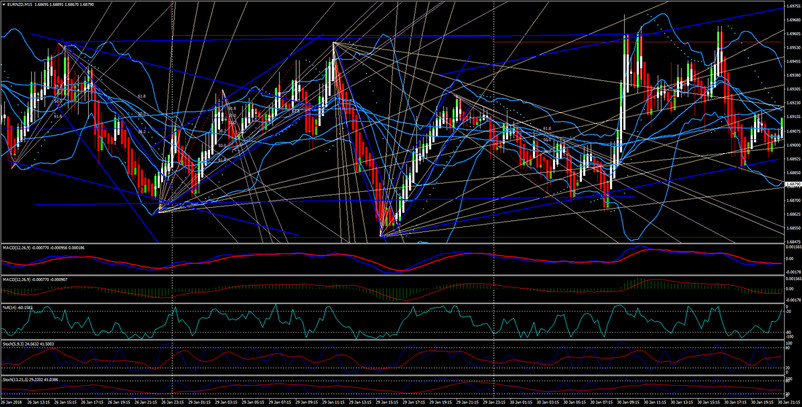
If your charts are looking like this or anything close to it, and you are struggling to get results then this is definitely your problem.
The solution to this stagnating situation is simplicity and clarity.
This is achieved by sticking to a handful of technical indicators and tools that have proved to work well for you and have earned your trust. All the other technical indicators are better to be eliminated from your trading toolbox completely or only looked at as secondary indicators to confirm a signal from your primary indicators/tools. Those who realize this are able to surpass the phase of stagnation, but those who don’t may never see their results improve sustainably.
How many indicators to use?
So, how many indicators should a trade use then? Is it only 1, 2, 3 or 5 indicators that Forex traders should rely on? Just how many is enough really?
In this article, we’ll try to give some perspective that beginners can use in the future to help them with their selection of technical tools and indicators.
First things first, there really is no right answer to that question. At least not one right answer. Every trader will have a different number of preferred indicators and a different answer that will be right for him. What we discuss here should not in any way limit you to experiment or to think outside of the box. Rather, this article should be used as a helpful guide in case this area is something you struggle with.
Just because we say that using fewer indicators works best for most traders doesn’t mean that it will be true for everyone. There sure are some traders who are successful with their charts looking like the one above and if that works well for you then great! Keep trading like that. But, if you are struggling to get results then keep reading this post to the end.
4 groups of technical Forex tools
As you may already know there are different types of technical indicators. In essence, choosing your palette of indicators comes down to the different aspects of the technical picture you need to be aware of. Too many indicators cause problems as we discussed above, but using too few can leave you unaware of important information.
There are 4 main types of technical tools used in Forex trading that show different aspects of the technical situation. Most traders do best by using 1 or 2 indicators of each type. This gives a nice balance without causing confusion or missing out on information.
We briefly discuss the 4 types below:
Lines and patterns
These are technical tools that you need to spot (draw) yourself.
Classical support and resistance, trendlines, channels, different chart patterns and even Fibonacci retracements and extensions are all valuable trading tools that fit in this category.
However, there is one downside to these tools and that is subjectivity since the lines are not generated automatically but every trader draws them on his/her charts. It’s not uncommon for 2 traders drawing the same trendline on the same chart to actually draw 2 different trendlines.
Trend indicators
Moving averages, the MACD, the ADX and similar indicators that are designed to show the trend are in this category. Essentially, every Forex trader needs a trend indicator of some sort, it’s just a matter of preference which one you will choose.
Momentum and Overbought/oversold indicators
The Stochastic and the RSI indicators are examples of momentum oscillators that aim to show the momentum behind the trend as well as overextended moves commonly known as overbought and oversold levels.
Momentum and extreme price levels are something every trader must be aware of so definitely use at least one indicator to show you this information.
Volatility indicators
The ATR and Bollinger Bands are indicators that were designed to show the current volatility in the market. This helps with placing stops and target levels so it’s definitely an aspect worth being aware of.
Again, there are many different volatility indicators and tools to choose from and what suits you best is a matter of personal preference.