Being aware of the big picture is always important in trading, regardless of your preferred trading style or the trading system you are using.
All trading strategies will benefit by trading in the direction of the larger - predominant trend. Similarly, a strong support or resistance level on larger timeframes will carry important implications for the price action on the lower timeframes.
No matter whether you are a swing trader, day trader or scalper, it’s critical to always be aware of all the important levels and developments on the higher timeframes, like the monthly and the weekly charts.
A strong trend on the larger timeframes is enough evidence of the strength or weakness of a particular currency pair. A trader can get miles ahead of the crowd just by simply avoiding to trade against a strong trend.
The great thing about using multiple timeframes to analyze the market is that you can confirm any signal you get on one chart by looking at the other timeframes of that currency pair. Several timeframes pointing to a reversal is a much better trading signal than having a reversal pattern on one timeframe only. By having multiple signals flashing “reversal” across several different timeframes, the trader can have greater confidence in any trade he takes in this way.
There are no limits to how this strategy can be used. All the same rules for technical analysis apply, it’s just a matter of analyzing several different timeframes and noting any conclusions.
There is, however, one cardinal rule to analyzing multiple timeframes and technical analysis in general:
- Higher timeframes always beat lower timeframes.
- This simply means that if you get a bearish pattern at resistance on the weekly chart and at the same time you also get a bullish pattern at support on the daily chart, the pattern on the weekly chart will be more important and more likely to prevail in the end.
- To sum up, the monthly chart beats the weekly, the weekly beats the daily, the daily beats the 4h chart and so on.
Finally, using multiple timeframes to trade and analyze the market offers better setups to enter the market at better prices and have tighter Stop-Losses in the end. This is an excellent way to trade because the risk vs. reward ratio can be increased severalfold. For this strategy, smaller timeframes are used as the trigger charts to pinpoint entry points while the reasons for the trade are based on developments on the higher timeframes.
In this regard, swing traders can use the monthly and the weekly charts to look for setups and then use the daily and the 4h charts for finding trigger signals to enter a trade. Or if you are a day trader or a scalper you can use the Daily chart to look for a bias in the market and take trades on “trigger” signals on the 1 hour, 15 minutes or 5-minute charts.
Now, let’s look at a real-world example of how agreeable signals from different timeframes can make a stronger case to take a trade.
EURUSD - The daily chart confirmed the signal on the weekly chart
This example of the EURUSD pair was a situation of resistance on the weekly timeframe being confirmed with a bearish reversal pattern on the daily timeframe.
EURUSD formed resistance in the 1.1500 – 1.1600 area during August - October 2015 after which the pair fell toward 1.05. The highs at 1.1600 were then retested in April and May of 2016 as EURUSD was making another bullish run.
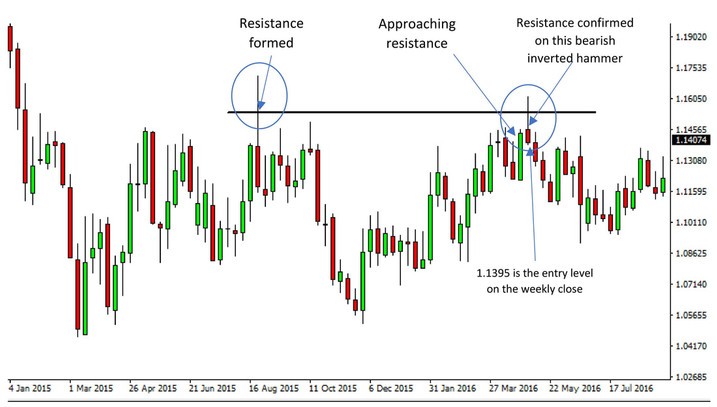
EURUSD Weekly Chart - Strong resistance in the 1.1500 – 1.1600 area
The 1.1500 – 1.1600 area was a major resistance zone on the monthly and weekly timeframes. Unsurprisingly, as soon as the pair hit it in 2016, trouble was imminent on the lower timeframes. Beginning on the 1-hour and 4-hour charts, EURUSD reversed in early May 2016.
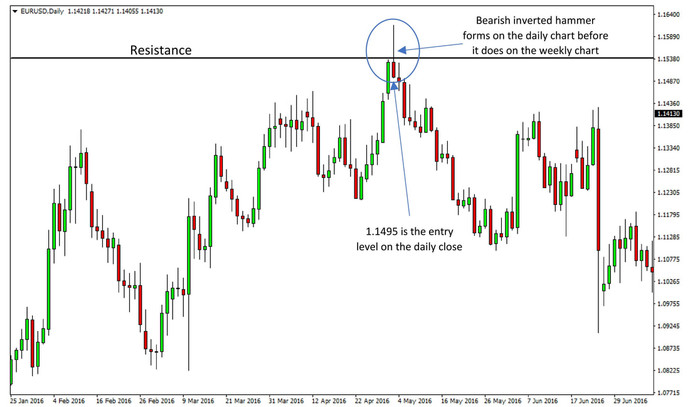
A bearish inverted hammer pattern (also known as a shooting star or Pin Bar ) appearing on the daily timeframe was the early signal for the top in place. This was a solid and valid signal to sell the pair as it confirmed a strong resistance (double top) on a higher timeframe.
We can see the reversal formations that occurred on the 4-hour and the Daily timeframes on the following charts.
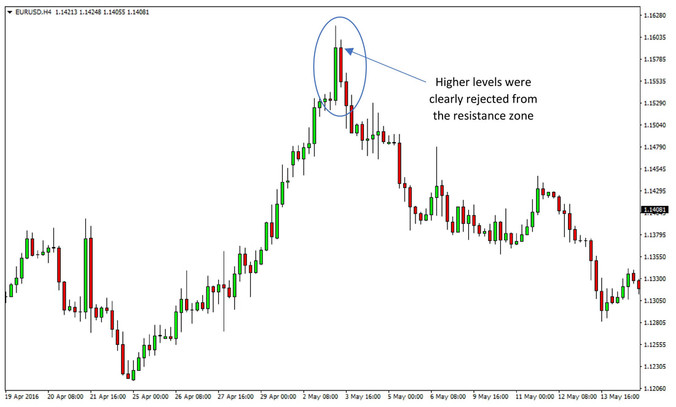
EURUSD 4h chart April – May 2016 – Higher prices were rejected in the 1.1600 area
As the pair continued to decline, it closed the week with a bearish inverted hammer pattern as well, and thus, confirmed the inverted hammer that appeared earlier on the daily chart. However, waiting for the pattern to be completed on the weekly timeframe would have resulted in entering the trade 100 pips lower (at worse price) and thus cut into your final profits.
EURUSD - The daily chart signaled the reversal earlier
Of course, in the end, even if signals on multiple timeframes confirm a trade, it’s not a guarantee that the trade will be a sure winner. However, trading is a game of probabilities, and using multiple timeframes, especially paying strict attention to higher timeframes, is one great way to tilt the probabilities in your favor that much more.