The Relative Strength Index and Moving Averages are very powerful and also effective indicators that are often used not only by less experienced traders, but also by great professionals who know very well why they do so.
And precisely because these indicators are so popular, it would be a shame not to show here at least one strategy in which both can be used simultaneously, which of course increases the probability of ultimate success, which is what everyone is undoubtedly after here.
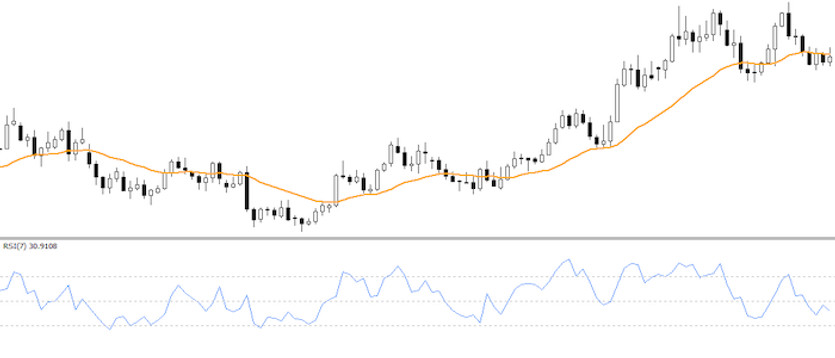
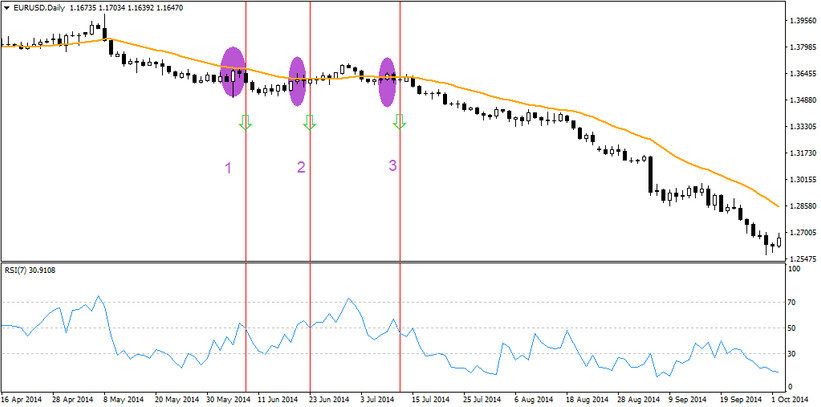
The title of today's strategy already suggests which specific indicators (RSI, MAexponential) and values (RSI-7, EMA-21, Timeframe-D1) were used. The whole point of the post then is to first look at the trend situation (Point1-price above EMA=long trend and vice versa). Next, there is then a wait for the price to hit the EMA (Point2), after which one must additionally wait for the RSI to return above/below 50 (red vertical lines). Only then entries are made.
The chart below shows situations where all of the above conditions relating to short trading opportunities are met.
With the RSI7 & EMA21 trading strategy on D1 it is possible to achieve a success rate of over 50%. Although in the eyes of many traders, this success rate may not seem very promising, the strength of today's strategy lies mainly in the fact that it can be used to trade very long positions on a given timeframe, and therefore even for several consecutive losses, one single position ending in profit is usually sufficient.