
While most forex traders use either technical or fundamental analysis as their primary trading guide, seasonality may also be very useful for trading analysis.
Seasonality trading is based on the concept that throughout each calendar year, the forex market tends to move according to certain patterns at different times during the year.
If several years of data are examined, it is usually established that the forex market tends to move in fairly predictable patterns.
For example, it has been shown that the month of September tends to be a month of high volatility in the forex market. This means that September tends to be one of the more lucrative months for forex traders who are aiming on high volatility periods by trading for example breakout strategies.
In the chart above, we highlighted months of September. Only two out of ten months were Inside Bars. Others tend to show a high volatility periods.
These seasonality patterns present profit making opportunities for traders. Although it is not advisable to trade solely based on seasonality patterns, it is advantageous to use seasonality to confirm what technical or fundamental analysis indicators are pointing to.
Since the forex market does tend to move in certain ways at certain times of the year, it is possible to increase profitability by incorporating seasonality patterns into your forex trading strategies. Here are a few examples of how seasonality has affected the forex market in previous years.
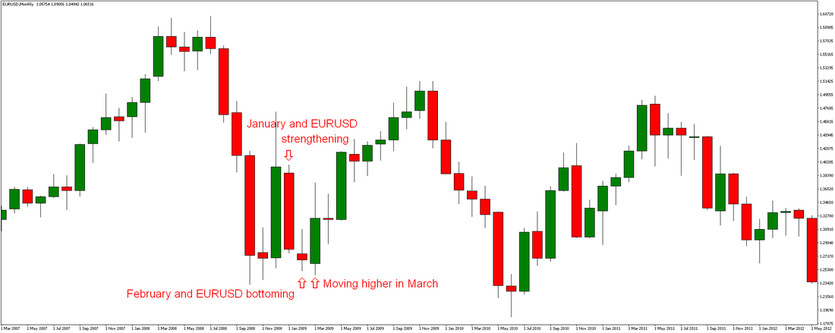
EUR/USD Seasonal Patterns:
January tends to be a negative month for the EUR/USD currency pair. Lots of foreign currency is usually sent overseas for investment purposes at the beginning of every year with the main aim of initiating new positions.
Since the US dollar is among the most liquid currencies in the world, lots of new investment placements are made in the US at the beginning of the year. This usually leads to a rally of the USD in January. Studies indicate that in 80% of cases, this is exactly what has happened with the EUR/USD currency pair during the month of January.
By mid-February, the EUR/USD tends to bottom, moving higher during March and rallying again by the end of April. More bottoming tends to take place during the month of June and August tends to be the worst month for the Euro.
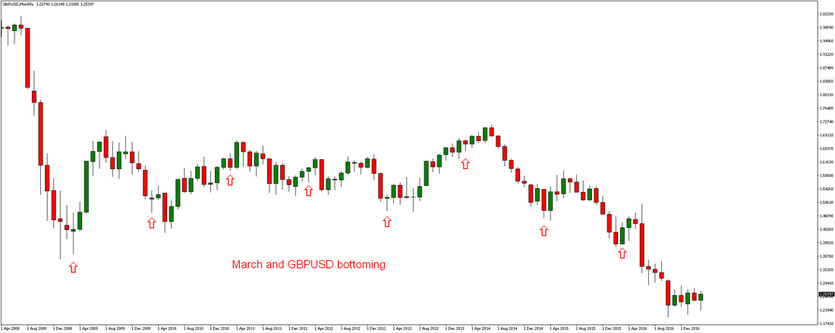
GBP/USD Seasonal Patterns:
With the GBP/USD, there is a tendency to bottom in the month of March, then move higher into the month of April. Like you can see in the chart below, in all cases (8 out of 8), there was a bullish candle after the month of March. There is also a tendency that GBPUSD is moving higher into August when it peaks.
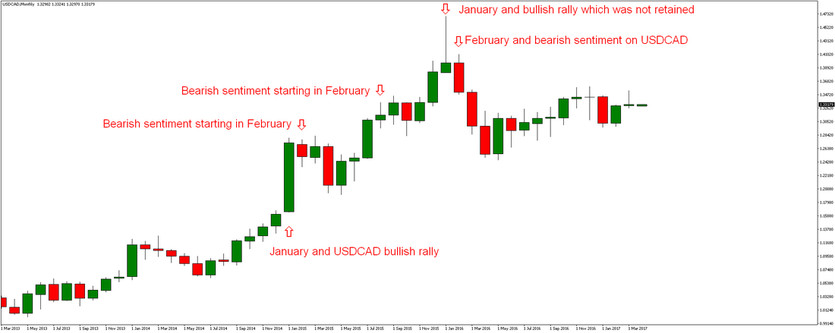
USD/CAD Seasonal Patterns:
USDCAD currency pair tends to rise in the beginning of each year. Then USDCAD topping by the end of February can be usually seen, and bearish sentiment usually takes place until the beginning of June. August is usually a peak for USDCAD, and USDCAD tends to decline into September.
Conclusion
Based on these observances, it is clear that seasonality does seem to play a role in how the forex market moves. If traders can identify these patterns, they should be able to benefit from them and to make more lucrative trades. However, remember that a further confirmation by a technical analysis always adds some extra probability points to the seasonal patterns trading.


