

Analyzing charts has become one of the essential requirements to operate in Forex, as it is the best way to understand the behavior of an asset and its value in the market.
Brokers, websites and online platforms offer a huge amount of graphs and charting tools based on different criteria, some of them in time, brands, price range or volume.
So, there are different types of technical charts with different purposes, such as tic or tick charts, line charts, bar charts, and charts of points and figures.
On this occasion, we will discuss what is a Tick chart, what makes it different from the other types of charts, how they operate, and what their advantages and disadvantages are compared to other technical indicators.
What is a Tick Chart?
A Tick chart is a type of technical indicator that, based on ticks, represents through a graph the price change of an asset during a given number of transactions in the market.
Unlike the time charts that paint a new bar with the most recent price after a set period of time, tick charts paint a new bar once there is a certain number of price changes (price ticks).
What do they work for?
The tick charts are very useful tools in Forex trading, especially when it comes to establishing very short-term commercial strategies, such as scalping. They are also usually excellent for timing an entry in the market that we are analyzing.
This type of graph lacks a timeframe and it is only oriented based on the number of ticks (changes) in the price, so they are often used by operators to evaluate market behavior, without taking into account their historical performance.
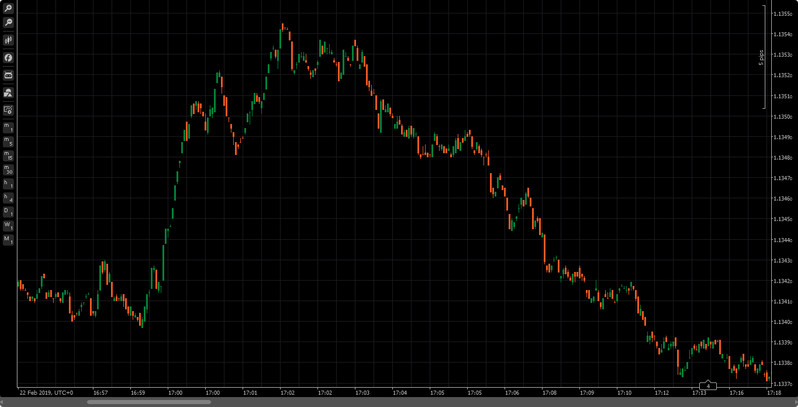
A 5-ticks tick chart of the EURUSD currency pair
Advantages and benefits of the Tick Chart
There are a lot of advantages that summarize how this chart operates with respect to others. Some of them are:
- Together with other types of technical indicators based on a time frame, they are usually very useful, in addition to providing data that classical indicators do not offer.
- They are indispensable to establish the correlation between the volume of the market and the development of the prices in the market, providing information that helps to understand the impulse and the direction or a possible reversal.
- They help detect trends, as well as the actual support and reactive values of an asset.
Disadvantages of Tick Charts
The only drawback of this chart type is the provenience and amount of data used by a platform to establish a tick. There are different tick charts with different types of data and almost none resemble the other, this is because they are based on the number of transactions completed, which can be different between different market makers and brokers depending on the data available.
Some of the factors that determine this data and that vary from graphic to graphic depending on the platform are:
- Different sources of data (different types of exchanges).
- Aggregate transactions from the power provider to reduce bandwidth.
- Packets of missing data during momentary disconnections of the network.
- The start of the calculation in different ticks.


