
The Forex is a decentralized market. The trades volumes of buying and selling currencies are distributed among banks; trades do not take place in single centers, as in the case of other commodity or financial actives. The objective disadvantage of such a trading device is the absence of clearly separated volumes of Buyers and Sellers.
The standard set of indicators of the MT4 terminal and other similar terminals, instead of volume numbers, indicates the total number of ticks (deals) or refers them to the side of bulls or bears, subjectively being guided only by the color and direction of the candlestick closing.
This is a misinterpretation, as evidenced by traders using VSA theory in trading, predicting market trends based on intraday turnovers. To predict the movement, they have to combine the final numbers of tick volumes that have passed during the formation of the candlestick with its graphical analysis - the size of the body, tails, etc.
VSA is a popular theory, especially in stock markets. This theory is real supply and demand that drives the price. But the element of technical analysis reduces the accuracy of forecasts, as does the relative size of the volume histogram, which in theory can be infinite in an active market, increasing sharply when large players enter or exit.
Candle Meter solves all of the above problems by disassembling a candle and breaking ticks into the volumes of bulls and bears in percentage terms. This makes it an ideal oscillator, a histogram, and a kind of adaptive moving average built based on the results of intraday turnover on each individual timeframe.
Indicator signals
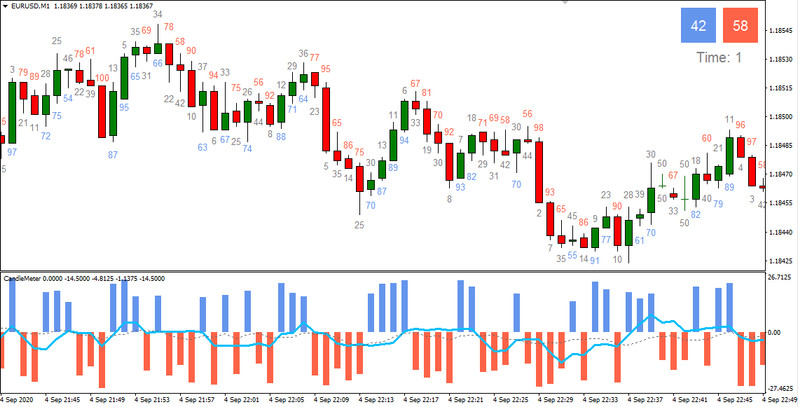
The CandleMeter indicator counts the number of ticks - bulls and bears deals - inside the current candle, and then displays them in three ways simultaneously:
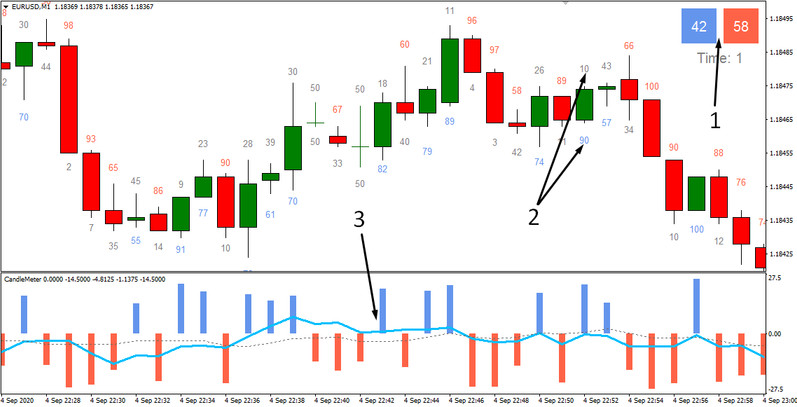
1. By the percentage of BUY and SELL deals displayed in the upper right corner of the chart, there is also an indicator showing the time until the end of the pattern formation.
2. Figures as a percentage on the chart history, on the High and Low of each candlestick.
3. A histogram, based on ticks for only one type of candlestick: blue bars for a bullish close, red bars for a bearish close. The size of the histogram columns indicates the relative strength of the buy or sell volumes, estimated based on the percentage of their ticks.
It should be noted here that in order to understand and correctly evaluate the readings of this instrument, it is necessary to know the theory of VSA.
Indicator settings
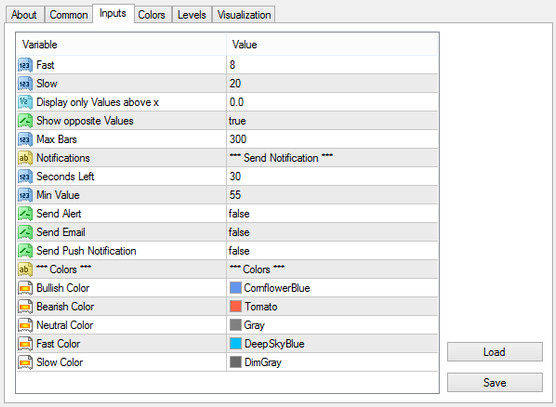
The main settings affecting the direct operation of the indicator are located in the Input parameters tab.
Fast - defines the period of the fast Moving Average;
Slow - the value of the slow Moving Average period;
Display only Values above x - filter for the threshold of displayed volumes; by default, it is zero. The indicator will exclude all data from the chart of the percentage volumes of bulls and bears below the value specified by the trader in this graph;
Max Bar - the number of candles in history on which indicator data is displayed;
Notification - setting the data refresh rate in seconds and ticks + the ability to receive alerts;
The Colors parameter is indicator color settings.
Conclusion
Candle Meter is a completely different tool from most indicators. As mentioned above, its main feature is the display of information that is useful in VSA analysis. Therefore, before using this tool, it is necessary to study the theory of VSA.


