
"I wish I could see the RSI of other timeframes ..."
Have you ever felt like that?
Well, if you did then you are at the right place! The Multiple Timeframes RSI (or "MTF RSI") will show you the values of your favorite RSI indicator of any timeframe on any other timeframe you have opened on the chart.
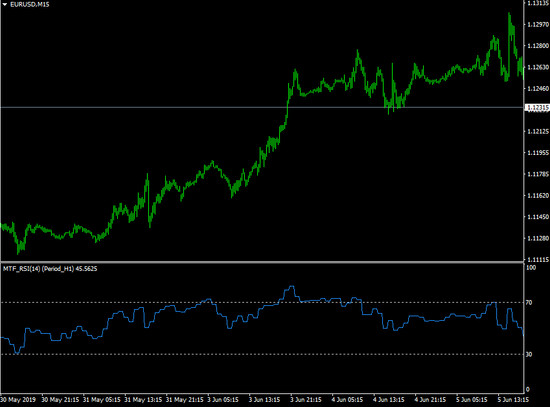
The 1-hour RSI displayed on a 15-minute chart
Look at the above image. This is a 15-minute chart showing the hourly RSI. The depiction of the RSI is somewhat daunting, but it will be practical enough. You can also display the weekly RSI on a 30-minute chart with this indicator.
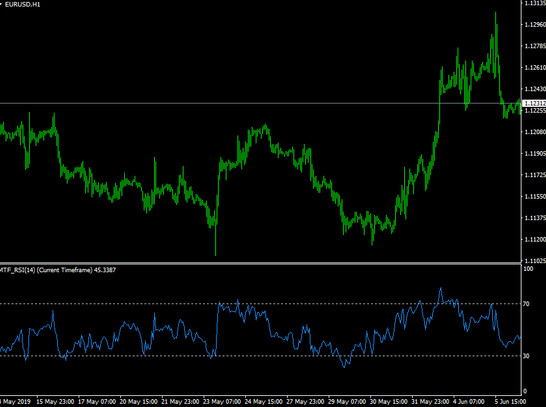
This MTF RSI is perfect for people doing multi-time frame analysis. You can also see trends in upper timeframes by looking at the RSI of other timeframes.
Specific usage:
Take care if the RSI of the upper timeframe is over 70 and/or under 30 when placing an order. It would be better to refrain from doing something like "I want to put a buy order on the 15-minute chart but the RSI on the 1-hour timeframe is over 70". With this MTF RSI indicator you do not have to take unnecessary trades.
Compatibility: MT4
Parameters:
- Time frame: This is the timeframe that is used to calculate the values for the RSI
- RSI Period: Periods for RSI calculation
- Applied Price: Choose from Close (0), Open (1), High (2) and Low (3)
Tip: Can’t open the downloaded archive file (ZIP or RAR)?
Try WinRAR for Windows or The Unarchiver for Mac .
Do you need help with installing this indicator into MT4 for Windows or Mac OS? Our guide HERE will help you.


