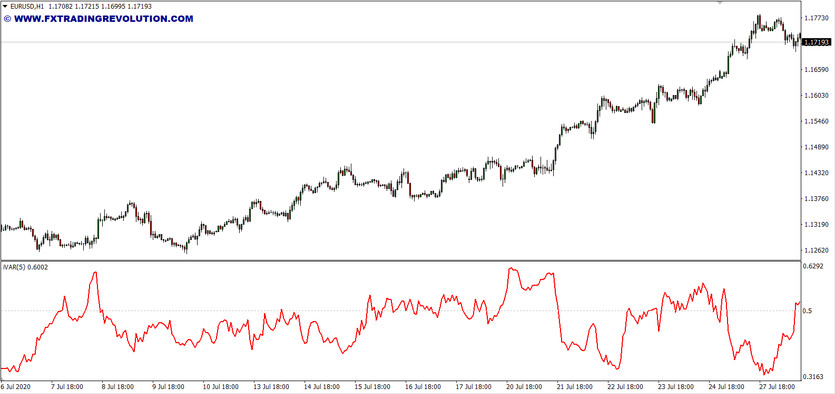
Breaking down price dynamics into trends and flats is the most important task in Forex. The iVAR indicator is a tool that allows you to identify the corresponding parts of the chart with a fairly high degree of reliability. iVar or variation index, as it is also commonly called, is a visually very simple indicator consisting of just one line in a separate window.
The indicator was created according to the well-known theory of financial time series. The theory is based on the opposition to chaos. The curve line of the indicator moves at the default level of 0.5. Thus, the indicator indicates the presence or absence of a trend. If the indicator line is below the level, then this indicates a trend. If it is above the level, it signals that there is a flat on the market. The further the indicator value is from the level, the stronger it is, and if the line is near the level, then this indicates uncertainty.
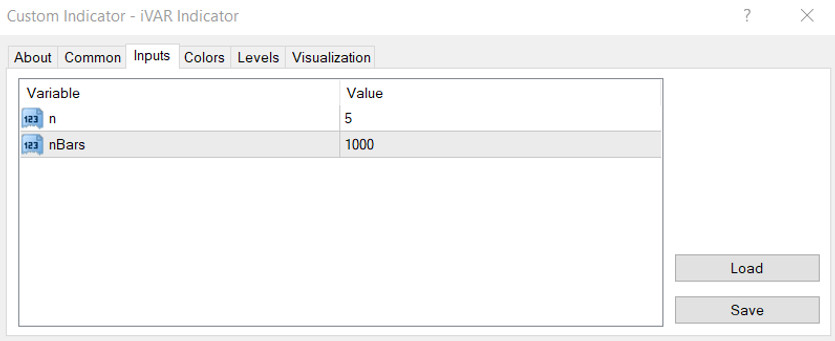
Indicator settings
There are two adjustable parameters in the iVAR settings:
n is a power of two, a mathematical indicator for calculating the variation index;
nBars - the number of bars used in calculations.
Indicator signals
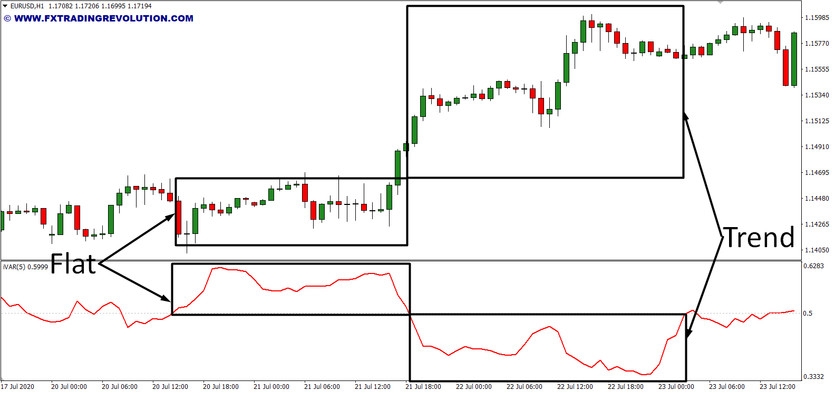
As noted above, the indicator contains the 0.5 level. The position of the iVAR line relative to this level signals the current market state:
The line below the level indicates the presence of a pronounced trend in the market. The extremely low position of the signal line indicates the end (correction) of the current trend;
If the line is above the 0.5 level, this indicates a sideways price movement (flat). Very high placement of the signal line signals a possible start of significant trends;
If the signal line is spinning near the 0.5 level, this is a sign of market uncertainty.
Conclusion
One of the strongest points of the iVar variation index is its good definition of flat areas. Timely identification of a flat will allow you to cut off false signals and significantly improve trading.
The main drawback of the indicator is its inability to indicate where the price is moving, i.e., the movement itself, its presence is visible, but not the direction. It will demonstrate the best results in conjunction with other tools that allow you to determine the trend's exact direction. The Variations Index is good for describing the current state of the market. It shows the trader the possible start points for strong movements. iVAR will protect you from opening erroneous trades by providing a timely signal of the beginning and fading of a market trend. It will also give accurate information about the consolidation in the market when it is better to refrain from trading at all.