
The modern world of trading has tens and hundreds of trading strategies, but those algorithms that were developed by real professionals deserve everyone's confidence.
Thomas DeMark is one of the most famous gurus in the field of stock trading. He is the developer of several dozen technical indicators that allow traders all over the world to earn a stable income. To create technical tools, DeMark not only used his personal experience but also considered existing trading strategies from a new angle.
For example, at one time, he became interested in the classical theory of cycles, which led to the birth of a new trading system. DeMark used the basic provisions of the theory but supplemented them with his own rules. This is how the new TD Sequential indicator and the strategy of the same name, developed on the basis of this algorithm, appeared.
TD Sequential MT4 Indicator - Cycle theory automation
As already mentioned, for TD Sequential Demark used the classical theory of cycles. Its basic rule is that the market is cyclical. That is, any of his movements is repeated after a certain time.
This means that a decline will always be followed by an increase and vice versa. All a trader needs to do to be successful is to catch the moment when one trend changes to another and open trade-in time.
Any cycle can be divided into several stages:
Cycle theory also assumes that when analyzing the market over a long time period, you can predict the behavior of highs and lows, focusing on the average value of past extremes.
However, as practice shows, these averaged values are played out quite rarely in the market, which is due to the not always predictable behavior of a large number of players, the release of fundamental news, and other factors. That is why DeMark decided to modify the classical theory.
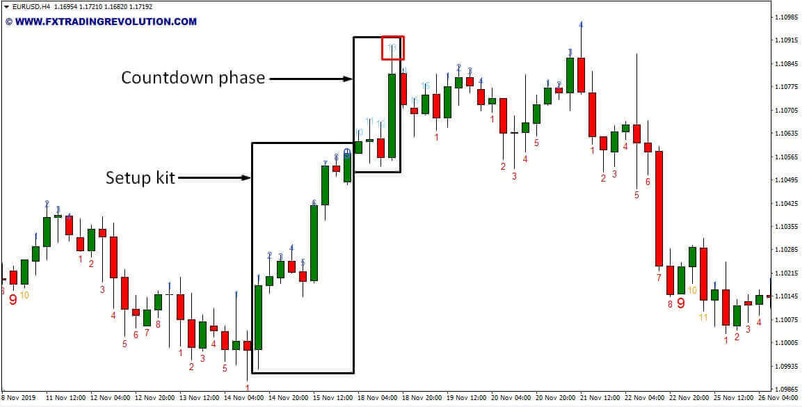
An experienced trader focused not on the potential calculated extremes, but on how the price behaves near them. In order to determine the places in which a trend reversal can occur, Demark suggests using a series of candles (bars), called a "set." It consists of 9 successively forming candles, followed by 13 or more, making up the "countdown phase."
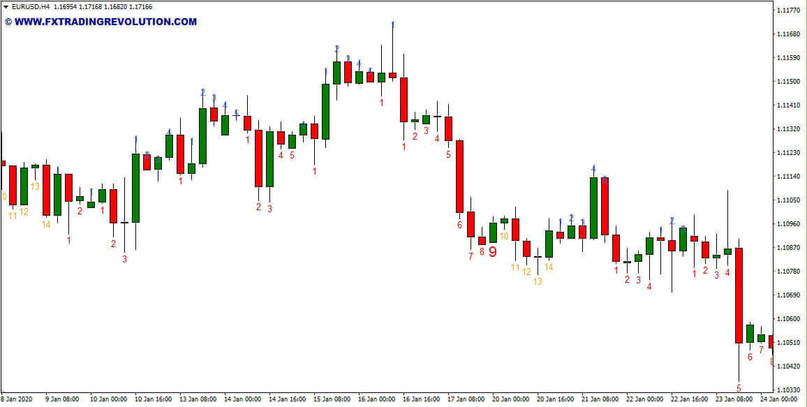
TD Sequential MT4 Indicator - trade example on a EURUSD chart
The selected candles must meet certain conditions. When working with the TD Sequential algorithm, the "setup set" and "sample phase" are automatically determined. What exactly do these candlestick combinations look like on the daily chart? For opening of long and short positions, different conditions are required:
In the first case, a downward movement coming to an end should be traced to the market. The closing prices of the considered candles (8-9 pcs.) Should be less than four candles before each bar of this sequence.
To opening sell orders, the conditions are opposite; that is, the end of an uptrend is traced in the market. In a combination of 9 consecutive bars, the price at which the bars closed must be greater than 4 bars ago.
As a rule, after the appearance of the "setup kit," the price starts to slow down. To be sure of this, you need to find the next combination of candles on the chart, which is called the "countdown phase." If you use the TD Sequential indicator, you don't have to do these manipulations manually. But it doesn't hurt to have an idea of how the 13 bars of interest are determined.
- To enter a long position after a set of 9 candles has formed, the following 13 should be considered. If the high of number 8 or 9 is higher than the low of 3-7 candles ago, this would be evidence that price has indeed slowed down.
- To open a short position, the lows of numbers 8 or 9 must be below the highs 3-7 candles ago.
The TD Sequential indicator automatically marks the candlestick combinations necessary to determine the market entry.
- For purchase, the color of the "setup kit" is red, and the "reference phase" is orange.
- For sale, the color of the "setup kit" is blue, and the "reference phase" is blue.
Since the algorithm does not provide for any other calculations besides price comparison, the TD Sequential indicator does not display any other data. It does not even allow manual adjustment since all data is taken from the candlestick chart.
Indicator signals
The deal is opened immediately after the 13th "countdown" candlestick closes. The potential profit can be very large because, in this case, it is possible to "catch" the very beginning of the trend. However, the risk is quite high. It is not uncommon for a new installation set to form after the "countdown phase."
A deal is opened only when, after the close of the 13th candlestick, there is confirmation that the market is indeed moving in the right direction. To open a buy, the closing price of a candle must be higher than the closing price of the one that formed four candles ago. For selling - the closing price is lower than the one that formed four candles ago.
Conclusion
The TD Sequential indicator is very easy to use, does not require additional settings, which cannot but attract beginners. We can say that it is itself a self-sufficient trading system. At the same time, signals to enter the market are generated quite rarely, so it is not suitable for those traders who prefer several transactions a day.
Tip: Can’t open the downloaded archive file (ZIP or RAR)?
Try WinRAR for Windows or The Unarchiver for Mac .
Do you need help with installing this indicator into MT4 for Windows or Mac OS? Our guide HERE will help you.


