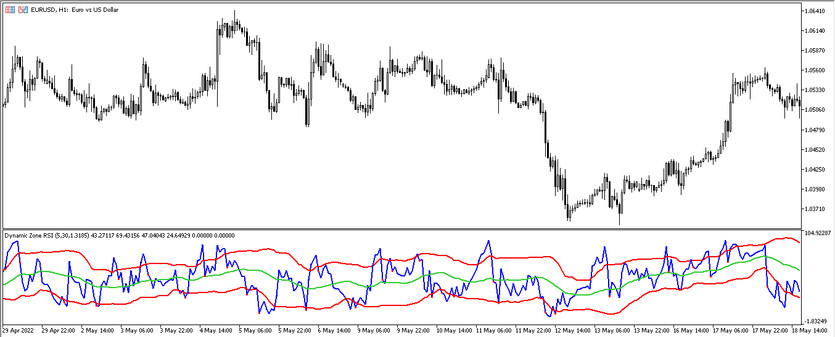
The Dynamic zone RSI is a new modification version of the standard forex RSI indicator. After the update, the RSI indicator has changed not only visually, but also became more accurate in its calculations. On the chart, the indicator is represented as four lines: the RSI line, as well as the upper, middle and lower, which, under certain conditions, will cross the RSI line. After one of these lines is crossed by the main one, points will appear in the indicator window that will indicate the direction of the transaction that should be opened. The Dynamic zone RSI indicator is suitable for trading on any timeframe, using any currency pairs.
Input parameters
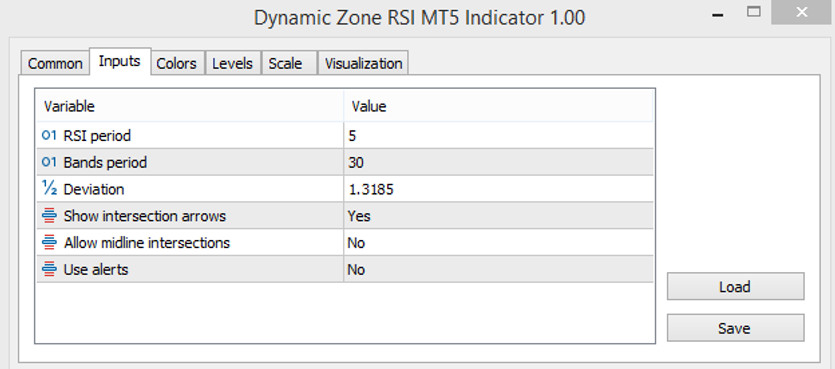
Dynamic zone RSI, unlike the previous version, has more advanced settings, consisting of six parameters that are responsible both for setting the indicator lines and for playing signals. Also, in the Colors section, the color gamut and width of the indicator values can be changed, and in In the Levels section, any levels have been added for own convenience.
- RSI Period - the period of the main line of the indicator, that is, RSI. The default value is 5.
- Bands Period - value of the period of other lines of the indicator. The default value is 30.
- Deviation - deviation of the indicator values. By default, it has a value of 1.3185.
- Show intersection arrows- parameter that, when set to Yes, indicates the intersection of the indicator lines in the form of dots. The default value is Yes.
- Allow middle intersection-parameter, if it is selected Yes, it will indicate the intersection of the middle line on the chart. The default value is No.
- Use Alerts - parameter responsible for playing alarm notifications when Yes is selected. The default value is No.
Indicator signals
Dynamic zone RSI signals are very easy to understand, especially after familiarizing with the previous version of this indicator, since the scheme of their work is practically the same. It will also be easier to trade if it is selected Yes in the Show intersection arrows parameter, as this will allow quickly finding the desired intersection and open a certain position.
Signal for Buy trades:
- The RSI line crosses the lower and middle lines from the bottom up, but does not reach the upper line, which is responsible for overbought in the market.
- At the moment of the desired intersection, a point appears in the indicator window, signaling the entry into the market.
After the formation of a point, after such an intersection of the lines, a long position can be opened, which should be closed after the appearance of the next point, which is intended to open a new trade.
Signal for Sell trades:
- The main line of the indicator moves down, crossing the upper and middle lines, but does not reach the lower one.
- After crossing the middle line down, a point is formed.
After the appearance of such a point in the indicator window, a short position may be opened. Such a trade should be closed after the appearance of a new point, since in this case it is necessary to consider opening a new position.
Conclusion
Dynamic zone RSI is very simple, but at the same time effective in use. Due to the presence of signals that are formed after the intersection of lines and the appearance of points, any trade can be very simple and profitable. However, its signals can sometimes be false, so each signal should be carefully checked by confirming the entry point to the market with other indicators or advisors. At the same time, before using it in practice, it is recommended to study the indicator using a demo account.