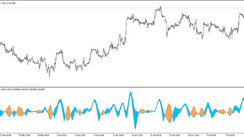
The Fisher indicator is very easy to use, its main task is to compare the current and the previous minimum or maximum of the price position, it is also used to determine the direction and strength of the trend. It is used for both MT4 and MT5. The Fisher is considered an oscillator, but as such, you should not expect success from it, since its signals are of a probabilistic nature. Its signals should be considered as recommendations and not as a clear indication of a trade. That is, the indicator shows the most probable price movement. As a result, the Fisher indicator should be used in combination with other indicators, or two Fisher oscillators with different period values -10 and 40 can be used simultaneously. The trade occurs if the values of both indicators match .
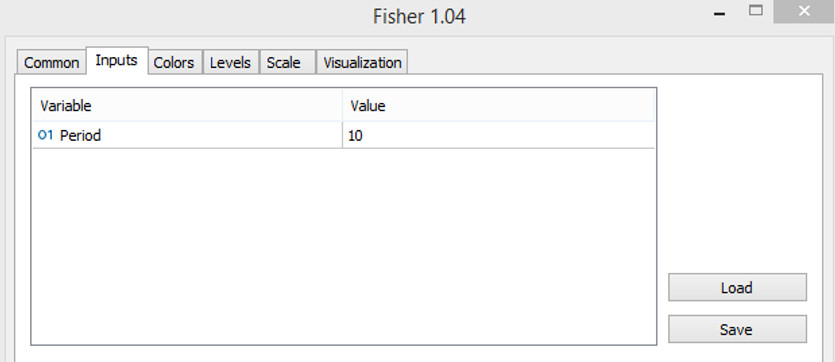
Input parameters
In the indicator inputs, you can only change the period, that is, the number of candles included in the calculation of the indicator. By default, the period value is 10. The larger the period value, the less false signals about a trend change occur, but the longer the indicator delay.
Definition of signals of the Fisher indicator
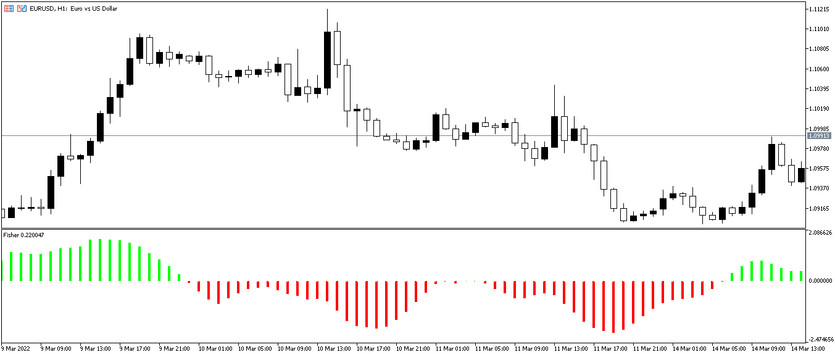
Signals to buy or sell in no way depend on the change in the color of Fisher, the color only affects the definition of price growth-uptrend or price fall-downtrend. A certain action is performed taking into account the fact that the last 4 candles of this indicator are not stable, this indicates a current unconfirmed price movement.
Trade with the Fisher indicator
If growth columns are replaced by falling columns, this indicates a price decrease. In this case, you need to prepare to open a sell order. If, on the contrary, falling columns are replaced by growth columns, you need to prepare to open a buy order. The more columns and the higher they are, the stronger the trend is up
When buying an asset, the formation of fall columns should be taken into account. That is, make a purchase if one or more peaks were formed during the fall of the column, and then a decline began. And when selling an asset, you need to monitor the formation of peaks of growth columns, and then their decline. It should be borne in mind that the overbought or oversold path is more profitable.
The Fisher indicator is also used to identify divergence zones: discrepancies between the indicator and chart readings. For example, Fisher formed 2-3 successively decreasing highs and the chart shows 2-3 increasing peaks, or vice versa.
Conclusion
The most important advantage of the Fisher indicator is that it does not redraw, that is, after a certain time, the columns do not change in any way after formation, which is very convenient. Thanks to this, false signals can be avoided. The Fisher is a high-quality and simple indicator without redrawing, which should be used in combination with other indicators to get more accurate signals. It can be used by both beginners and experienced users. But for the correct development of the indicator, you should carefully study all the details.